PGE(1) stimulation of HEK293 cells generates multiple contiguous domains with different [cAMP]: role of compartmentalized phosphodiesterases
- PMID: 17088426
- PMCID: PMC2064521
- DOI: 10.1083/jcb.200605050
PGE(1) stimulation of HEK293 cells generates multiple contiguous domains with different [cAMP]: role of compartmentalized phosphodiesterases
Abstract
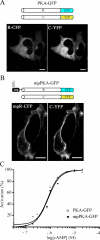
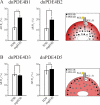
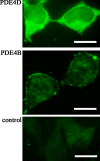
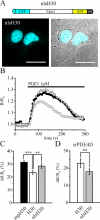
There is a growing appreciation that the cyclic adenosine monophosphate (cAMP)-protein kinase A (PKA) signaling pathway is organized to form transduction units that function to deliver specific messages. Such organization results in the local activation of PKA subsets through the generation of confined intracellular gradients of cAMP, but the mechanisms responsible for limiting the diffusion of cAMP largely remain to be clarified. In this study, by performing real-time imaging of cAMP, we show that prostaglandin 1 stimulation generates multiple contiguous, intracellular domains with different cAMP concentration in human embryonic kidney 293 cells. By using pharmacological and genetic manipulation of phosphodiesterases (PDEs), we demonstrate that compartmentalized PDE4B and PDE4D are responsible for selectively modulating the concentration of cAMP in individual subcellular compartments. We propose a model whereby compartmentalized PDEs, rather than representing an enzymatic barrier to cAMP diffusion, act as a sink to drain the second messenger from discrete locations, resulting in multiple and simultaneous domains with different cAMP concentrations irrespective of their distance from the site of cAMP synthesis.
Figures


Similar articles
-
An anchored PKA and PDE4 complex regulates subplasmalemmal cAMP dynamics.EMBO J. 2006 May 17;25(10):2051-61. doi: 10.1038/sj.emboj.7601113. Epub 2006 Apr 27. EMBO J. 2006. PMID: 16642035 Free PMC article.
-
Spatiotemporal dynamics of beta-adrenergic cAMP signals and L-type Ca2+ channel regulation in adult rat ventricular myocytes: role of phosphodiesterases.Circ Res. 2008 May 9;102(9):1091-100. doi: 10.1161/CIRCRESAHA.107.167817. Epub 2008 Mar 27. Circ Res. 2008. PMID: 18369156
-
Reciprocal regulation of calcium dependent and calcium independent cyclic AMP hydrolysis by protein phosphorylation.J Neurochem. 2002 May;81(3):422-33. doi: 10.1046/j.1471-4159.2002.00903.x. J Neurochem. 2002. PMID: 12065651
-
Phosphodiesterases and compartmentalized cAMP signalling in the heart.Eur J Cell Biol. 2006 Jul;85(7):693-7. doi: 10.1016/j.ejcb.2006.01.002. Epub 2006 Feb 7. Eur J Cell Biol. 2006. PMID: 16466668 Review.
-
Restricted diffusion of a freely diffusible second messenger: mechanisms underlying compartmentalized cAMP signalling.Biochem Soc Trans. 2006 Aug;34(Pt 4):495-7. doi: 10.1042/BST0340495. Biochem Soc Trans. 2006. PMID: 16856842 Review.
Cited by
-
A PI3Kγ mimetic peptide triggers CFTR gating, bronchodilation, and reduced inflammation in obstructive airway diseases.Sci Transl Med. 2022 Mar 30;14(638):eabl6328. doi: 10.1126/scitranslmed.abl6328. Epub 2022 Mar 30. Sci Transl Med. 2022. PMID: 35353541 Free PMC article.
-
Radixin assembles cAMP effectors Epac and PKA into a functional cAMP compartment: role in cAMP-dependent cell proliferation.J Biol Chem. 2011 Jan 7;286(1):859-66. doi: 10.1074/jbc.M110.163816. Epub 2010 Nov 3. J Biol Chem. 2011. PMID: 21047789 Free PMC article.
-
Cyclic nucleotide phosphodiesterase 1A: a key regulator of cardiac fibroblast activation and extracellular matrix remodeling in the heart.Basic Res Cardiol. 2011 Nov;106(6):1023-39. doi: 10.1007/s00395-011-0228-2. Epub 2011 Oct 20. Basic Res Cardiol. 2011. PMID: 22012077 Free PMC article.
-
Mdm2 directs the ubiquitination of beta-arrestin-sequestered cAMP phosphodiesterase-4D5.J Biol Chem. 2009 Jun 12;284(24):16170-16182. doi: 10.1074/jbc.M109.008078. Epub 2009 Apr 16. J Biol Chem. 2009. Retraction in: J Biol Chem. 2020 Aug 21;295(34):12328. doi: 10.1074/jbc.W120.015374. PMID: 19372219 Free PMC article. Retracted.
-
Mapping binding sites for the PDE4D5 cAMP-specific phosphodiesterase to the N- and C-domains of beta-arrestin using spot-immobilized peptide arrays.Biochem J. 2007 May 15;404(1):71-80. doi: 10.1042/BJ20070005. Biochem J. 2007. PMID: 17288540 Free PMC article.
References
-
- Abrahamsen, H., G. Baillie, J. Ngai, T. Vang, K. Nika, A. Ruppelt, T. Mustelin, M. Zaccolo, M. Houslay, and K. Tasken. 2004. TCR- and CD28-mediated recruitment of phosphodiesterase 4 to lipid rafts potentiates TCR signaling. J. Immunol. 173:4847–4858. - PubMed
-
- Bacskai, B.J., B. Hochner, M. Mahaut-Smith, S.R. Adams, B.K. Kaang, E.R. Kandel, and R.Y. Tsien. 1993. Spatially resolved dynamics of cAMP and protein kinase A subunits in Aplysia sensory neurons. Science. 260:222–226. - PubMed
-
- Baillie, G.S., J.D. Scott, and M.D. Houslay. 2005. Compartmentalisation of phosphodiesterases and protein kinase A: opposites attract. FEBS Lett. 579:3264–3270. - PubMed
-
- Barnes, A.P., G. Livera, P. Huang, C. Sun, W.K. O'Neal, M. Conti, M.J. Stutts, and S.L. Milgram. 2005. Phosphodiesterase 4D forms a cAMP diffusion barrier at the apical membrane of the airway epithelium. J. Biol. Chem. 280:7997–8003. - PubMed
Publication types
MeSH terms
Substances
Grants and funding
LinkOut - more resources
Full Text Sources
Other Literature Sources

