. 2006 Dec 22;281(51):39444-54.
doi: 10.1074/jbc.M608056200. Epub 2006 Oct 23.

Dimeric Eg5 maintains processivity through alternating-site catalysis with rate-limiting ATP hydrolysis

Affiliations

Dimeric Eg5 maintains processivity through alternating-site catalysis with rate-limiting ATP hydrolysis

Troy C Krzysiak et al. J Biol Chem. .

Abstract

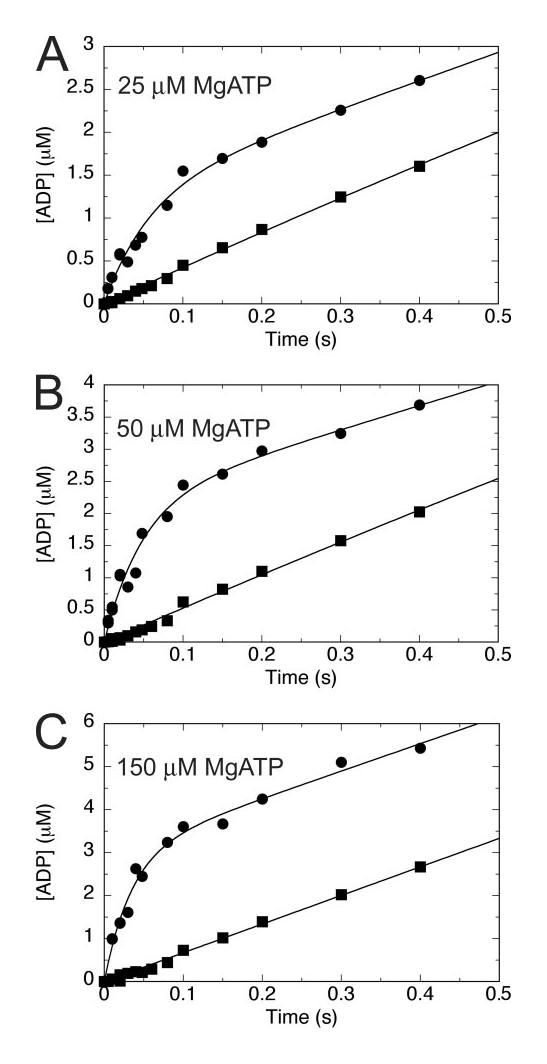
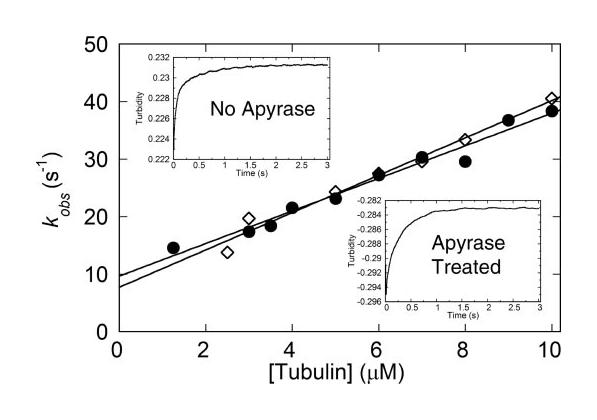
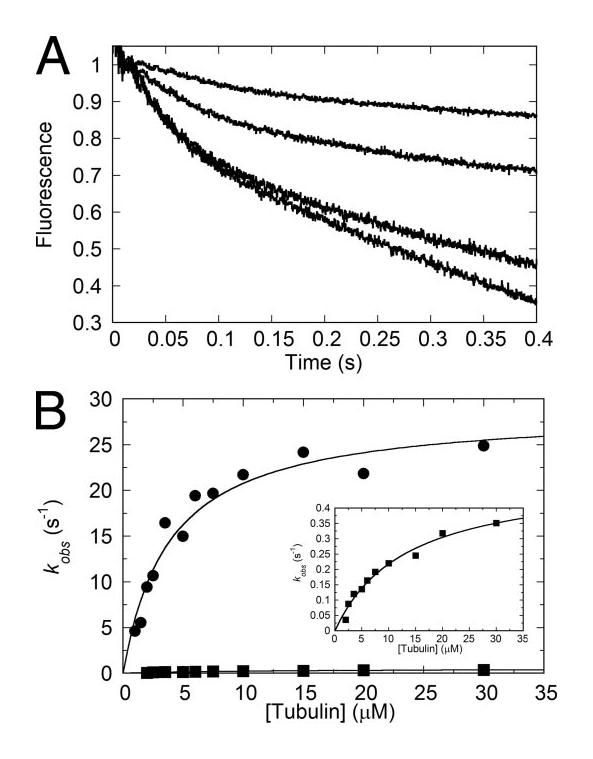
Eg5/KSP is a homotetrameric, Kinesin-5 family member whose ability to cross-link microtubules has associated it with mitotic spindle assembly and dynamics for chromosome segregation. Transient-state kinetic methodologies have been used to dissect the mechanochemical cycle of a dimeric motor, Eg5-513, to better understand the cooperative interactions that modulate processive stepping. Microtubule association, ADP release, and ATP binding are all fast steps in the pathway. However, the acid-quench analysis of the kinetics of ATP hydrolysis with substrate in excess of motor was unable to resolve a burst of product formation during the first turnover event. In addition, the kinetics of P(i) release and ATP-promoted microtubule-Eg5 dissociation were observed to be no faster than the rate of ATP hydrolysis. In combination the data suggest that dimeric Eg5 is the first kinesin motor identified to have a rate-limiting ATP hydrolysis step. Furthermore, several lines of evidence implicate alternating-site catalysis as the molecular mechanism underlying dimeric Eg5 processivity. Both mantATP binding and mantADP release transients are biphasic. Analysis of ATP hydrolysis through single turnover assays indicates a surprising substrate concentration dependence, where the observed rate is reduced by half when substrate concentration is sufficiently high to require both motor domains of the dimer to participate in the reaction.


Figures

FIGURE 1
FIGURE 1
MantATP binding kinetics. An MT·Eg5-513 complex was first treated with apyrase and then rapidly mixed with MgMantATP in the stopped-flow instrument. Final concentrations after mixing were 0.5 μm Eg5-513/8 μm MTs for 0.5–4 μm MgMantATP and 2.5 μm Eg5-513/8 μm MTs for 4–50 μm MgMantATP. A, the averaged fluorescence transients for the listed MgMantATP concentrations. B, each transient was fit to a double exponential function, and the observed rate of fluorescence enhancement for the first exponential is plotted as a function of mantATP concentration. The data display a hyperbolic dependence and were fit to Equation 1 with K1 = 0.11 ± 0.02 μm−1, k+1′= 54 ± 2 s−1 and apparent Kd, mantATP = 9.4 μm. B, inset, shows the linearity of the data at low substrate concentrations. C, the observed rates of the second exponential phase also display a linear dependence with respect to the mantATP concentration range examined. The data were fit to Equation 2, which provided an apparent second-order rate constant of mantATP binding of 0.14 ± 0.01 μm−1 s−1. C, inset, a representative transient, 0.5 μm Eg5-513/8 μm MTs and 0.5 μm MantATP, displaying the completion of both exponential phases. The amplitude of the initial fast phase is equal to the amplitude of the second phase with the corresponding rates of 0.41 s−1 and 0.12 s−1 for the fast and slow phases, respectively.
FIGURE 2
FIGURE 2
Pulse-chase kinetics of ATP binding. A preformed MT·Eg5 complex was rapidly mixed with Mg[α-32P]ATP and chased with 10 mm unlabeled MgATP. A, individual transients displaying an ATP concentration-dependent pre-steady-state burst of product formation followed by a linear phase of product formation. B, the observed exponential rates were plotted as a function of MgATP concentration and fit to a hyperbola: kmax = 52 ± 7s−1 and apparent Kd,ATP = 20.4 ± 14.5 μm. C, inset gel, not all Eg5 was bound to the MTs at the start of the experiment. Displayed are two load volumes of the supernatant and pellet fractions of centrifuged MT·Eg5 complexes. C, the burst amplitude, as micromolar ADP formed, is plotted. The hyperbola extrapolates to 4.1 μm of possible 4.5 μm maximal amplitude based on the fraction of motor that was bound to the MTs at the start of the experiment. B and C, data from individual experiments; DF, data from multiple experiments. D, the hyperbolic fit of the observed burst rates provided k+1′= 50 ± 3s−1 and the apparent Kd,ATP, = 35 ± 7 μm. The inset displays ATP binding at low ATP concentrations where the data can be linearly fit to Equation 2. The second-order rate constant for ATP binding given by the slope is k+1 = 1.15 ± 0.1 μm−1s−1, and the off-rate provided by the y-intercept is 1.4 ± 0.6 s−1. E, the observed rates for subsequent ATP binding events obtained from the linear phase of the transients were plotted and fit to a hyperbola: kslow = 5.7 ± 0.4 μm ADP·s−1, apparent Kd,ATP = 27 ± 7 μm. F, the burst amplitudes from multiple experiments have been normalized according to the amount of Eg5 sites that partition with the MT pellet on the day of the experiment and were plotted as a function of MgATP concentration. The hyperbolic fit extrapolates to 97 ± 5% of Eg5 active sites with the apparent Kd,ATP = 57 ± 8μm. Final concentrations of the MT·Eg5 complexes were as follows: 1 μm Eg5-513/6μm MTs for 1–3 μm ATP, 2 μm Eg5-513/6 μm MTs for 2–6 μm ATP, and 5 μm Eg5-513/6 μm MTs for 5–300 μm.
FIGURE 3
FIGURE 3
Comparison of pulse-chase and acid-quench transients. Pulsechase (●) and acid-quench (■) experiments were performed on the same day at the specified MgATP concentrations in AC. Note the absence of a pre-steady-state burst in the acid-quench transients, yet present in each pulsechase transient.
FIGURE 4
FIGURE 4
Single turnover acid-quench kinetics of ATP hydrolysis. A, a preformed MT·Eg5 complex was rapidly mixed with Mg[α-32P]ATP in the quench-flow instrument. Final concentrations were 15 μm Eg5-513/20 μm MTs (□), 20 μm Eg5-513/25 μm MTs (◆), 30 μm Eg5-513/35 μm MTs (●), 45 μm Eg5-513/50 μm MTs (△), and 1 μm MgATP. Each transient was fit to a single exponential function. B, the observed exponential rates were plotted as a function of Eg5-513 concentration and hyperbolically fit; k+2 = 5.4 ± 1 s−1. ◆, data from an MT·Eg5 complex that was pretreated with apyrase, k+2 = 9.6 ± 1.7 s−1. Inset, transients obtained on the same day from a MT·Eg5 complex (45 μm Eg5-513, 50 μm MTs final concentrations after mixing) in the absence of apyrase pretreatment (●) and treated with apyrase (◆). No treatment, kobs = 3.3 ± 0.1 s−1 compared with 4.8 ± 0.2 s−1 with apyrase treatment. C, the rate of ATP hydrolysis was examined by varying the MgATP concentration to evaluate ATP hydrolysis for one head versus two heads of the dimer at single turnover conditions.
FIGURE 5
FIGURE 5
Phosphate release kinetics. A, a preformed MT·Eg5-513 complex plus MDCC-PBP was mixed in the stopped-flow instrument with MgATP. Final concentrations: 0.5 μm Eg5-513, 2 μm MTs, 5 μm MDCC-PBP, and 10 μm MgATP. The transient displays an amplitude corresponding to 3 μm Pi with kobs = 0.22 ± 0.0002 s−1. B, a preformed MT·Eg5-513 complex plus MDCCPBP was mixed in the stopped-flow instrument withMgATPat single turnover conditions. Final concentrations: 15 μm Eg5-513, 20 μm MTs, 20 μm MDCCPBP, and 1 μm MgATP. The data were fit to a single exponential function with kobs = 1.9 ± .002 s−1 with an amplitude of 0.98 μm. A and B, insets, the KH2PO4 standard curves used to convert fluorescence voltage to micromolar Pi released for the corresponding experiments.
FIGURE 6
FIGURE 6
Dissociation of the MT·Eg5-513 complex. A, a preformed MT·Eg5 complex was rapidly mixed in the stopped-flow instrument with either buffer, MgAMPPNP, MgATPγS. MgADP, or MgATP. In each case the nucleotide syringe contained an additional 200 mm KCl resulting in final concentrations of 100 mm KCl, 1mm MgAXP, 4 μm HsEg5-513, and 6 μm tubulin. The average of four to six transients for each condition is displayed. The ATP and ADP transients were fit to a double exponential function yielding the initial fast kobs = 6.2 ± 0.2 s−1 and 23.9 ± 0.6 s−1 and the slower second phase kobs = 0.76 ± 0.02 s−1 and 1.2 ± 0.02 s−1, respectively. The amplitudes associated with the fast and slow phases were approximately equal for both the ATP and ADP transients. B, the observed rates of both the fast (●) and slow (■) exponential phases were plotted as a function of MgATP concentration. A hyperbolic fit to data from the initial rapid phase produces a kmax = 6.7 ± 0.2 s−1 and 1/2,ATP = 6.9 ± 1.2 s−1. The data from the slower exponential phase does not vary as a function of MgATP concentration (average kobs = 0.7 ± 0.1 s−1).C, dissociation of the MT·Eg5-513 complex was examined in the absence of additional KCl. Eg5-513 was mixed with MTs plus MgATP. Final concentrations were 5 μm Eg5, 5 μm MTs, and 1mM ATP. The resultant transient exhibits an increase in turbidity at 14.4 ± 0.3 s−1 followed by a 100-ms lag, and a biphasic decrease in turbidity of equal amplitude (phase 1 kobs = 1.05 ± 0.05 s−1; phase 2 kobs = 0.19 ± 0.01 s−1).
FIGURE 7
FIGURE 7
MT·Eg5-513 association. Eg5-513 with or without apyrase treatment was rapidly mixed with MTs in the stopped-flow instrument, and the increase in turbidity was monitored. Final concentrations were 1.25 μm Eg5-513 for 1.25–2.5 μm MTs, 2.5 μm Eg5-513 for 2.5–5 μm MTs, and 5 μm Eg5-513 for 5–10 μm MTs. The individual transients were fit to a double exponential function, and the observed rate of the initial fast phase was plotted as a function of MT concentration. The data were fit to Equation 4, yielding a second order rate constant for complex formation in the absence of apyrase treatment (●) of 2.8 ± 0.2 μm−1 s−1 and 3.2 ± 0.2 s−1 with apyrase treatment (◇), and an off-rate provided by the y-intercept of 9.7 ± 1 s−1 (no apyrase treatment) and 7.7 ± 1.4 4m−1 s−1 with apyrase treatment. Insets, representative MT·Eg5 association transients with and without apyrase treatment (upper left, 5 μm Eg5-513 and 8 μm MTs final) or with apyrase treatment (lower right, 5 μm Eg5-513 and 5 4m MTs final concentrations).
FIGURE 8
FIGURE 8
MantADP release kinetics. The Eg5·MantADP complex was rapidly mixed with MTs plus MgATP in the stopped-flow instrument, and the decrease in MantADP fluorescence emission was monitored. Final concentrations were 2 μm Eg5-513·mantADP, 1 mM MgATP, and 2–30 μm MTs. A, the individual transients were biphasic. B, the observed rates of both phases were plotted as a function of MT concentration and hyperbolically fit. The fits for the first (●) and second (■) phases extrapolate to k+4 = 29 ± 2 s−1, K1/2,MT = 3.8 ± 0.7 μm, kmax = 0.5 ± .04 s−1, and K1/2,MT = 13 ± 2 μm, respectively. Inset, the observed rates of the second phase.
TABLE 1
TABLE 1
Comparison of monomeric and dimeric Eg5 constants

Similar articles

Cited by

References

    1. Sawin KE, LeGuellec K, Philippe M, Mitchison TJ. Nature. 1992;359:540–543. - PubMed
    1. Whitehead CM, Rattner JB. J. Cell Sci. 1998;111:2551–2561. - PubMed
    1. Sharp DJ, McDonald KL, Brown HM, Matthies HJ, Walczak C, Vale RD, Mitchison TJ, Scholey JM. J. Cell Biol. 1999;144:125–138. - PMC - PubMed
    1. Wilde A, Lizarraga SB, Zhang L, Wiese C, Gliksman NR, Walczak CE, Zheng Y. Nat. Cell Biol. 2001;3:221–227. - PubMed
    1. Goshima G, Vale RD. J. Cell Biol. 2003;162:1003–1016. - PMC - PubMed

Publication types