

A summarization approach for Affymetrix GeneChip data using a reference training set from a large, biologically diverse database
- PMID: 17059591
- PMCID: PMC1624855
- DOI: 10.1186/1471-2105-7-464
A summarization approach for Affymetrix GeneChip data using a reference training set from a large, biologically diverse database
Abstract
Background: Many of the most popular pre-processing methods for Affymetrix expression arrays, such as RMA, gcRMA, and PLIER, simultaneously analyze data across a set of predetermined arrays to improve precision of the final measures of expression. One problem associated with these algorithms is that expression measurements for a particular sample are highly dependent on the set of samples used for normalization and results obtained by normalization with a different set may not be comparable. A related problem is that an organization producing and/or storing large amounts of data in a sequential fashion will need to either re-run the pre-processing algorithm every time an array is added or store them in batches that are pre-processed together. Furthermore, pre-processing of large numbers of arrays requires loading all the feature-level data into memory which is a difficult task even with modern computers. We utilize a scheme that produces all the information necessary for pre-processing using a very large training set that can be used for summarization of samples outside of the training set. All subsequent pre-processing tasks can be done on an individual array basis. We demonstrate the utility of this approach by defining a new version of the Robust Multi-chip Averaging (RMA) algorithm which we refer to as refRMA.
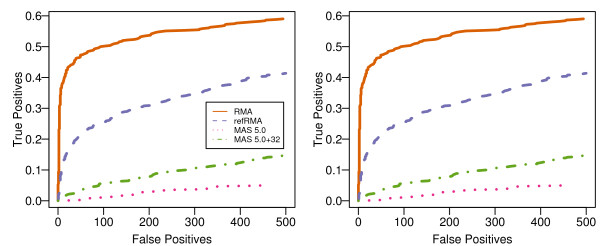
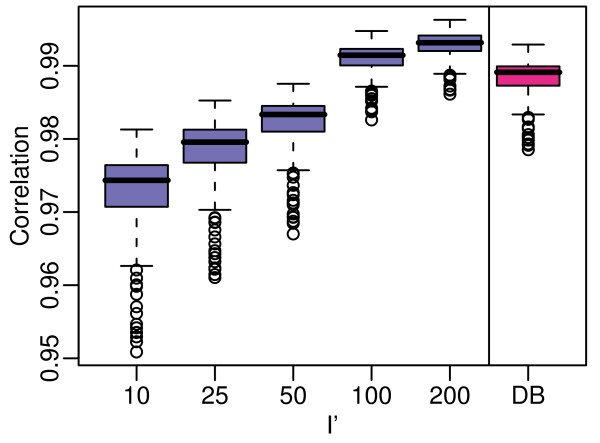
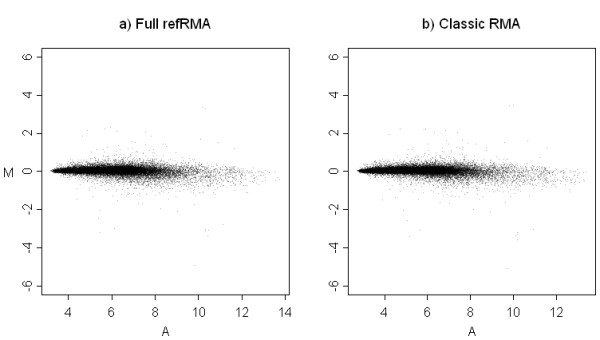
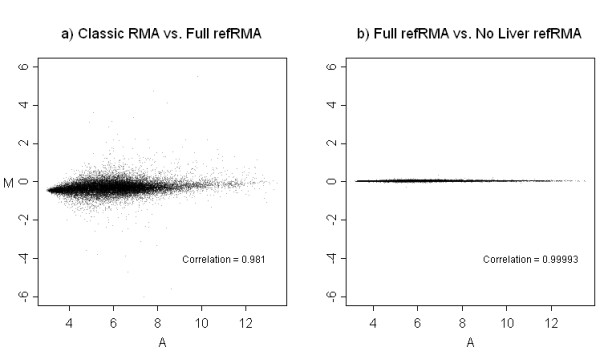
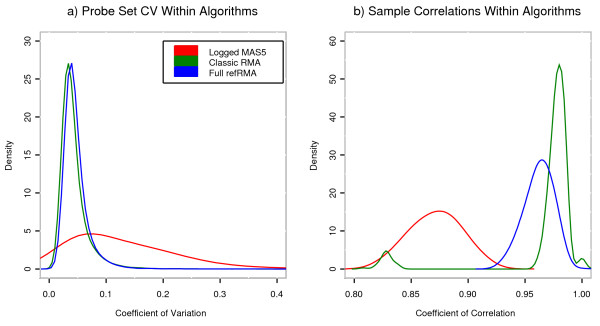
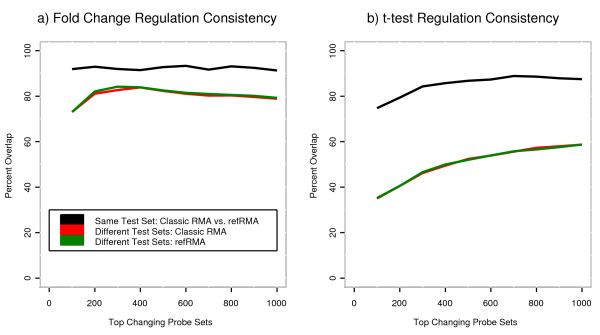
Results: We assess performance based on multiple sets of samples processed over HG U133A Affymetrix GeneChip arrays. We show that the refRMA workflow, when used in conjunction with a large, biologically diverse training set, results in the same general characteristics as that of RMA in its classic form when comparing overall data structure, sample-to-sample correlation, and variation. Further, we demonstrate that the refRMA workflow and reference set can be robustly applied to naïve organ types and to benchmark data where its performance indicates respectable results.
Conclusion: Our results indicate that a biologically diverse reference database can be used to train a model for estimating probe set intensities of exclusive test sets, while retaining the overall characteristics of the base algorithm. Although the results we present are specific for RMA, similar versions of other multi-array normalization and summarization schemes can be developed.
Figures
Similar articles
-
Tissue-specific RMA models to incrementally normalize Affymetrix GeneChip data.Annu Int Conf IEEE Eng Med Biol Soc. 2008;2008:2419-22. doi: 10.1109/IEMBS.2008.4649687. Annu Int Conf IEEE Eng Med Biol Soc. 2008. PMID: 19163190
-
A probe-treatment-reference (PTR) model for the analysis of oligonucleotide expression microarrays.BMC Bioinformatics. 2008 Apr 14;9:194. doi: 10.1186/1471-2105-9-194. BMC Bioinformatics. 2008. PMID: 18410691 Free PMC article.
-
A verification protocol for the probe sequences of Affymetrix genome arrays reveals high probe accuracy for studies in mouse, human and rat.BMC Bioinformatics. 2007 Apr 20;8:132. doi: 10.1186/1471-2105-8-132. BMC Bioinformatics. 2007. PMID: 17448222 Free PMC article.
-
On the causes of outliers in Affymetrix GeneChip data.Brief Funct Genomic Proteomic. 2009 May;8(3):199-212. doi: 10.1093/bfgp/elp027. Brief Funct Genomic Proteomic. 2009. PMID: 19734302 Review.
-
Trends to store digital data in DNA: an overview.Mol Biol Rep. 2018 Oct;45(5):1479-1490. doi: 10.1007/s11033-018-4280-y. Epub 2018 Aug 2. Mol Biol Rep. 2018. PMID: 30073589 Review.
Cited by
-
The impact of alcoholic drinks and dietary factors on epigenetic markers associated with triglyceride levels.Front Genet. 2023 Feb 15;14:1117778. doi: 10.3389/fgene.2023.1117778. eCollection 2023. Front Genet. 2023. PMID: 36873949 Free PMC article.
-
Probe Region Expression Estimation for RNA-Seq Data for Improved Microarray Comparability.PLoS One. 2015 May 12;10(5):e0126545. doi: 10.1371/journal.pone.0126545. eCollection 2015. PLoS One. 2015. PMID: 25966034 Free PMC article.
-
Asymmetric microarray data produces gene lists highly predictive of research literature on multiple cancer types.BMC Bioinformatics. 2010 Sep 27;11:483. doi: 10.1186/1471-2105-11-483. BMC Bioinformatics. 2010. PMID: 20875095 Free PMC article.
-
A transient receptor potential channel-related model based on machine learning for evaluating tumor microenvironment and immunotherapeutic strategies in acute myeloid leukemia.Front Immunol. 2022 Dec 16;13:1040661. doi: 10.3389/fimmu.2022.1040661. eCollection 2022. Front Immunol. 2022. PMID: 36591215 Free PMC article.
-
Identification of key biomarkers for predicting CAD progression in inflammatory bowel disease via machine-learning and bioinformatics strategies.J Cell Mol Med. 2024 Mar;28(6):e18175. doi: 10.1111/jcmm.18175. J Cell Mol Med. 2024. PMID: 38451044 Free PMC article.
References
-
- Wu Z, Irizarry RA, Gentleman R, Martinez-Murillo F, Spencer F. A model-based background adjustment for oligonucleotide expression arrays. Journal of the American Statistical Association. 2004;99:909–917. doi: 10.1198/016214504000000683. - DOI
-
- Affymetrix . In: Guide to Probe Logarithmic Intensity Error (PLIER) Estimation. Affymetrix I, editor. Santa Clara, CA, ; 2005.
Publication types
MeSH terms
Substances
Grants and funding
LinkOut - more resources
Full Text Sources
Other Literature Sources
