. 2007 Jan 15;92(2):641-53.
doi: 10.1529/biophysj.106.096560. Epub 2006 Oct 20.

pH-Dependence of extrinsic and intrinsic H(+)-ion mobility in the rat ventricular myocyte, investigated using flash photolysis of a caged-H(+) compound

Affiliations

pH-Dependence of extrinsic and intrinsic H(+)-ion mobility in the rat ventricular myocyte, investigated using flash photolysis of a caged-H(+) compound

Pawel Swietach et al. Biophys J. .

Abstract

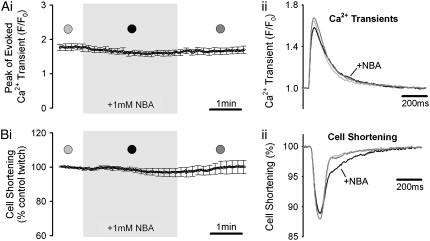
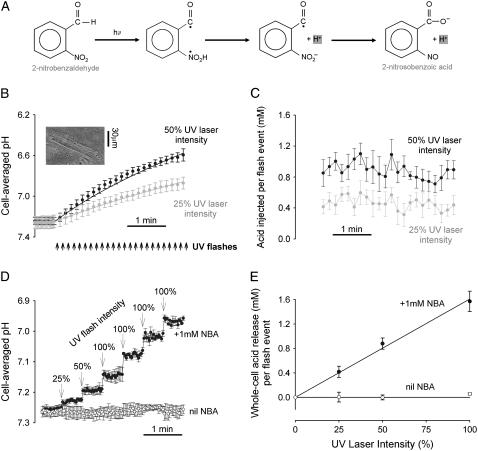
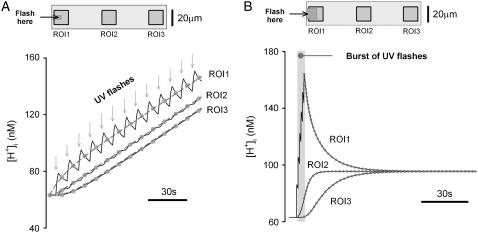
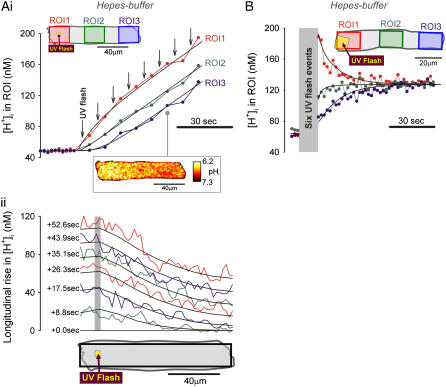
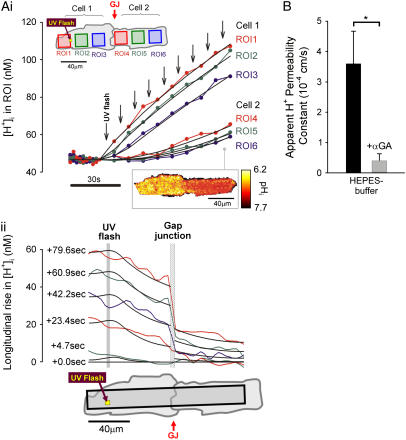
Passive H(+)-ion mobility within eukaryotic cells is low, due to H(+)-ion binding to cytoplasmic buffers. A localized intracellular acidosis can therefore persist for seconds or even minutes. Because H(+)-ions modulate so many biological processes, spatial intracellular pH (pH(i))-regulation becomes important for coordinating cellular activity. We have investigated spatial pH(i)-regulation in single and paired ventricular myocytes from rat heart by inducing a localized intracellular acid-load, while confocally imaging pH(i) using the pH-fluorophore, carboxy-SNARF-1. We present a novel method for localizing the acid-load. This involves the intracellular photolytic uncaging of H(+)-ions from a membrane-permeant acid-donor, 2-nitrobenzaldehyde. The subsequent spatial pH(i)-changes are consistent with intracellular H(+)-mobility and cell-to-cell H(+)-permeability constants measured using more conventional acid-loading techniques. We use the method to investigate the effect of reducing pH(i) on intrinsic (non-CO(2)/HCO(3)(-) buffer-dependent) and extrinsic (CO(2)/HCO(3)(-) buffer-dependent) components of H(i)(+)-mobility. We find that although both components mediate spatial regulation of pH within the cell, their ability to do so declines sharply at low pH(i). Thus acidosis severely slows intracellular H(+)-ion movement. This can result in spatial pH(i) nonuniformity, particularly during the stimulation of sarcolemmal Na(+)-H(+) exchange. Intracellular acidosis thus presents a window of vulnerability in the spatial coordination of cellular function.


Figures

FIGURE 1
FIGURE 1
Effect of 2-nitrobenzaldehyde on excitation-contraction coupling. Rat myocytes were superfused with HEPES-buffered media and field-stimulated at 1Hz. After a period of pacing (>1 min), cells were exposed to superfusates containing 1 mM NBA. The evoked Ca2+-transient (A) and cell-shortening (B) were measured simultaneously (mean ± SE; n = 10). (Ai) Peak systolic Cai2+-fluorescence is plotted versus time (peak systolic, F, normalized to diastolic Ca2+-fluorescence, F0). (Bi) Mean contraction amplitude (for each experiment, normalized to initial control contraction [averaged over 1 min]) is plotted versus time. (Aii) Superimposed time courses of Ca2+-transients from a representative experiment, taken at times indicated in panel Ai. (Bii) Superimposed time courses of cell-shortening, taken from same experiment as Aii.
FIGURE 2
FIGURE 2
H+-uncaging in whole-cell (A). The energy from UV light catalyzes the intramolecular redox between the nitryl and aldehyde group of 2-nitrobenzaldehyde, producing 2-nitrosobenzoic acid which dissociates to its anion and H+. (B) Inset shows rat myocyte superfused with HEPES-buffered NT containing 1mM NBA and 30 μM cariporide. (Main panel) repetitive exposure of entire myocyte to UV flash events at 0.11Hz (denoted by arrows) produces a cumulative acidification which was monitored in between flash-events using carboxy-SNARF fluorescence: acid-loading rate, 4.16 mM/min at 25% laser intensity (shaded circles; n = 10) and 8.14 mM/min at 50% laser intensity (solid circles; n = 10). The continuous curves show model-predictions for constant acid-injection rates into a compartment with a buffering capacity as defined in (16). (C) The amount of acid released per flash-event, calculated from the change in pHi after each flash-event multiplied by the intrinsic buffering capacity (n = 10). (D) Rat myocytes were superfused with HEPES-buffered NT containing 30 μM cariporide. In some experiments, 1 mM NBA was included in superfusates. Cells (n = 6 with NBA, n = 7 without NBA) were exposed to a UV flash-event of varying magnitude (25–100% of full power) every 30 s. Between flash events, pHi was imaged every 2.1 s. (E) The stepwise fall in pHi recorded in D was converted into a measure of acid released per flash-event (Jinj = −ΔpH × β), using values for buffering-capacity (β) measured previously (16). This has been plotted as a function of laser intensity. Data points in all panels shown as mean ± SE.
FIGURE 3
FIGURE 3
Protocols for producing localized acid-loads. A computational model was used to simulate localized H+-uncaging within a rectangular model-cell (100 × 25 μm) featuring a formula image of 10−6 cm2/s. (A) Protocol 1: simulation of repetitive H+-uncaging at 0.11 Hz (denoted by arrows) in a small ROI (5 × 5 μm) positioned at the left end of the cell (see schematic diagram at top). The [H+]-rise averaged in three downstream 15 × 15 μm ROIs is plotted versus time. Solid circles denote the mid-times between flash-events. The dashed lines illustrate the solution to a constant-source diffusion equation. (B) Protocol 2: simulation of brief sequence of flash-events in a 10 × 10 μm ROI positioned at the left end of the model-cell (inset). After inducing a 150 nM longitudinal H+-gradient, flashing was stopped to allow the gradient to relax. Time courses of the rise and subsequent relaxation of [H+]i in three downstream 15 × 15 μm ROIs are plotted as the continuous curves. Solid symbols indicate the expected timing of pHi data acquisition during the relaxation phase.
FIGURE 4
FIGURE 4
Local H+-uncaging in an isolated myocyte (Ai). Protocol 1: rat myocyte, superfused with HEPES-buffered Tyrode containing 1 mM NBA and 30 μM cariporide. Repetitive flash-events (0.11 Hz) were applied to a 5 × 5μm ROI positioned at the left end of the cell. [H+] was averaged in three ROIs every 2.1 s (colored circles, coded to match the colored ROIs shown in schematic diagram at top); points have been interpolated to form continuous time courses. Superimposed black traces show best-fit solutions to a constant-source diffusion equation with a formula image of 10 × 10−7 cm2/s. Inset shows a calibrated pH-map during acid-loading, taken at the time indicated. (Aii) Data from (i) are presented (colored traces) as longitudinal [H+]-profiles at consecutive times, together with best-fit model predictions (black lines). The shaded vertical bar indicates the position of the H+-uncaging site. (B) Protocol 2: rat myocyte, superfused with HEPES-buffered Tyrode containing 1 mM NBA and 30 μM cariporide. Six UV flash-events (0.5 Hz) were applied to a 15 × 15 μm ROI positioned toward the left end of the cell. After termination of flash sequence, the relaxation of [H+] averaged in three ROIs (traces color-coded to match ROIs shown in schematic diagram) is shown, along with superimposed best-fit model-predictions (black traces) for a formula image of 5.5 × 10⁻⁷ cm2/s.
FIGURE 5
FIGURE 5
Local H+-uncaging in a myocyte cell-pair (Ai). End-to-end rat myocyte cell-pair, superfused with HEPES-buffered Tyrode containing 1 mM NBA and 30 μM cariporide. Repetitive flash-events (0.11 Hz) were applied to a 5 × 5 μm ROI at the left end of the cell-pair. The color-coded time courses illustrate the cumulative rise in [H+]. The superimposed black traces show best-fit solutions to a constant-source diffusion equation with a formula image of 9.5 × 10⁻⁷ cm2/s and a formula image of 1.6 × 10⁻³ cm/s. Inset shows a calibrated pH-map during acid loading, taken at the time indicated. (Aii) Data from i are presented as longitudinal [H+]-profiles at consecutive times, together with best-fit model-predictions. The vertical solid-gray bar indicates position of the acid-release site; diagonally lined bar highlights a discontinuity in the [H+]-profile coincident with the gap junction. (B) Mean ±SE for formula image measured with (n = 6) and without (n = 7) 60 μM α-glycerrhetinic acid (αGA) in superfusates, derived from experiments like that shown in Ai. Asterisk denotes significant difference (P < 0.05).
FIGURE 6
FIGURE 6
Intrinsic and extrinsic components of Hi+-mobility are both pH-sensitive (A). A rat myocyte was superfused with CO2/HCO3-buffered Tyrode containing 1 mM NBA and 30 μM cariporide. Repetitive flash-events (0.11 Hz) were applied to a 5 × 5μm ROI positioned at the left end of the cell (protocol 1). The colored circles show the rise of [H+] averaged in three ROIs (color-coded and positioned as shown in schematic diagram at top). Superimposed black traces show best-fit solutions to a constant-source diffusion equation with a formula image of 22 × 10−7 cm2/s. Inset at bottom shows a calibrated pH-map of the cell during acid-loading, taken at time indicated. (B) Experiments using either protocol 1 (solid triangles) or 2 (open squares) for local H+-uncaging (see text, and Fig. 3) in an isolated myocyte were performed from a range of starting pHi-values, while superfusing the cell with HEPES-buffered (blue symbols) or CO2/HCO3-buffered (red symbols) solution. Starting pHi was preset using a weak acid/base prepulse technique (see Methods). Blue triangles, n = 4, 11, 34, 46, 98, 42, 25; blue open squares, n = 19, 22, 5; red triangles, n = 7, 10, 11, 10, 18, 37, 9, 8. The dashed line illustrates the pHi-dependence of formula image measured previously using a different technique (12). All red data-points are significantly different from the dashed line (z-test, 95% confidence level). In some experiments, 100 μM ATZ was added to CO2/HCO3 superfusates to block carbonic anhydrase (green triangles, n = 17,19). These data points were not significantly different from the dashed line (z-test, 95% confidence level). (C) The change in formula image in the presence of CO2/HCO3 buffer is plotted as a function of pHi (red symbols, without ATZ; green symbols, with ATZ). The dashed red line represents the difference between the best-fit sigmoidal curve to the formula image data in the presence and absence of carbonic buffer. (D) The fraction of formula image that is measured in CO2/HCO3-buffered solution (in the absence of ATZ) that is attributable to carbonic (i.e., nonintrinsic) buffering. This fraction is close to 0.3 over the entire pHi-range studied. Data points in panels B and C show mean ± SE.

Similar articles

Cited by

References

    1. Bountra, C., K. Kaila, and R. D. Vaughan-Jones. 1988. Effect of repetitive activity upon intracellular pH, sodium and contraction in sheep cardiac Purkinje fibres. J. Physiol. 398:341–360. - PMC - PubMed
    1. Elliott, A. C., G. L. Smith, and D. G. Allen. 1994. The metabolic consequences of an increase in the frequency of stimulation in isolated ferret hearts. J. Physiol. 474:147–159. - PMC - PubMed
    1. Ellis, D., and R. C. Thomas. 1976. Microelectrode measurement of the intracellular pH of mammalian heart cells. Nature. 262:224–225. - PubMed
    1. Bountra, C., and R. D. Vaughan-Jones. 1989. Effect of intracellular and extracellular pH on contraction in isolated, mammalian cardiac muscle. J. Physiol. 418:163–187. - PMC - PubMed
    1. Komukai, K., F. Brette, C. Pascarel, and C. H. Orchard. 2002. Electrophysiological response of rat ventricular myocytes to acidosis. Am. J. Physiol. Heart Circ. Physiol. 283:H412–H422. - PubMed

Publication types

LinkOut - more resources