Comparative Study
. 2006 Oct 11;26(41):10461-71.
doi: 10.1523/JNEUROSCI.2579-06.2006.

Different mechanisms exist for the plasticity of glutamate reuptake during early long-term potentiation (LTP) and late LTP

Affiliations
Comparative Study

Different mechanisms exist for the plasticity of glutamate reuptake during early long-term potentiation (LTP) and late LTP

Juan D Pita-Almenar et al. J Neurosci. .

Abstract

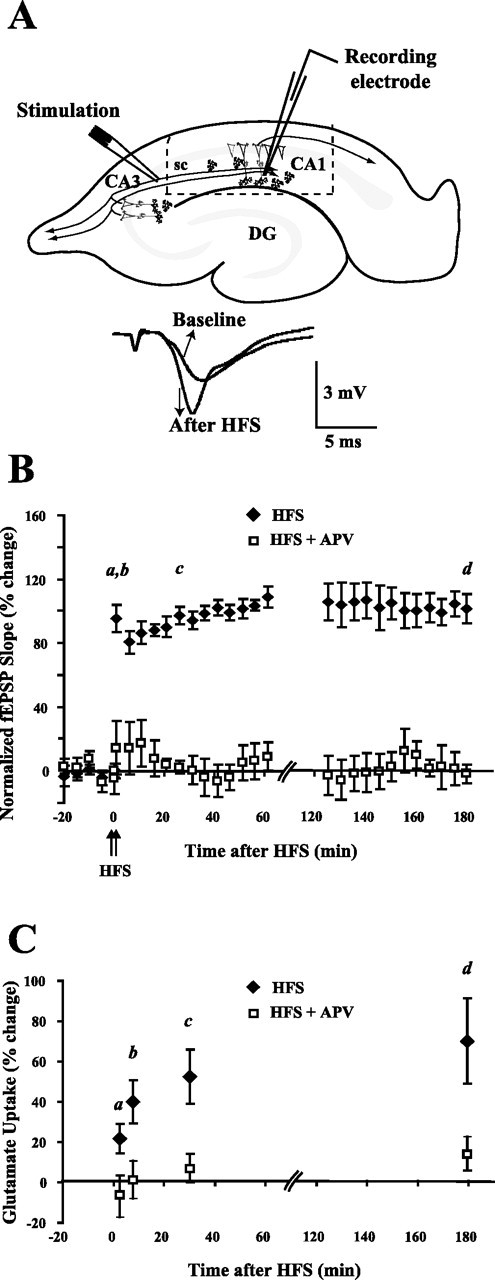
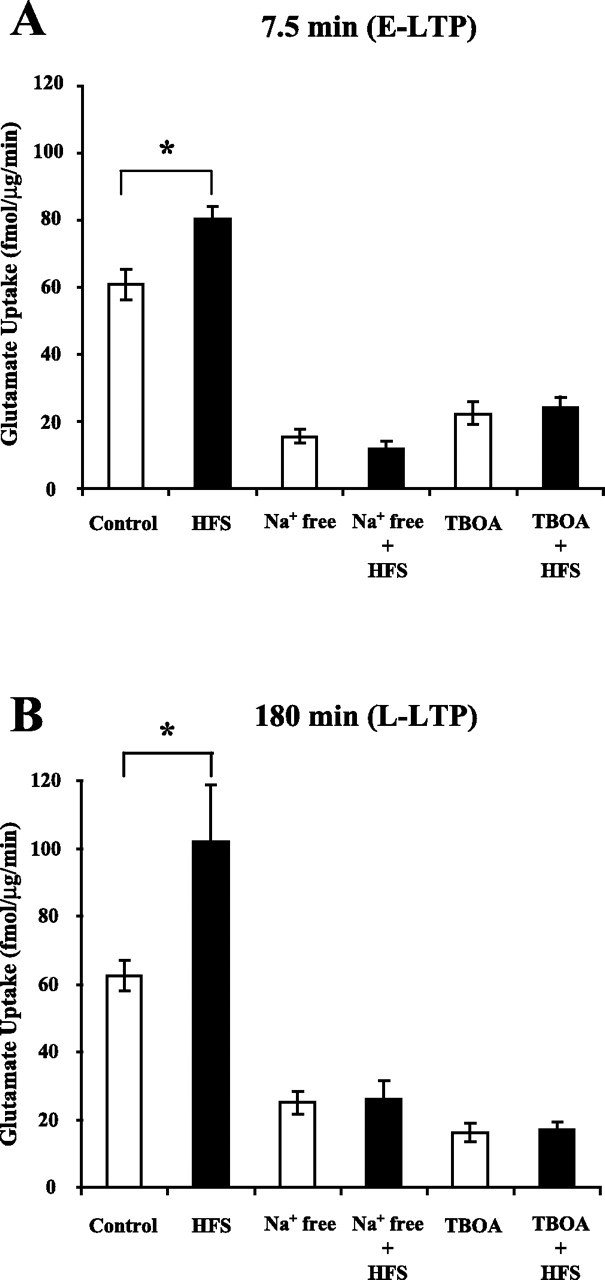
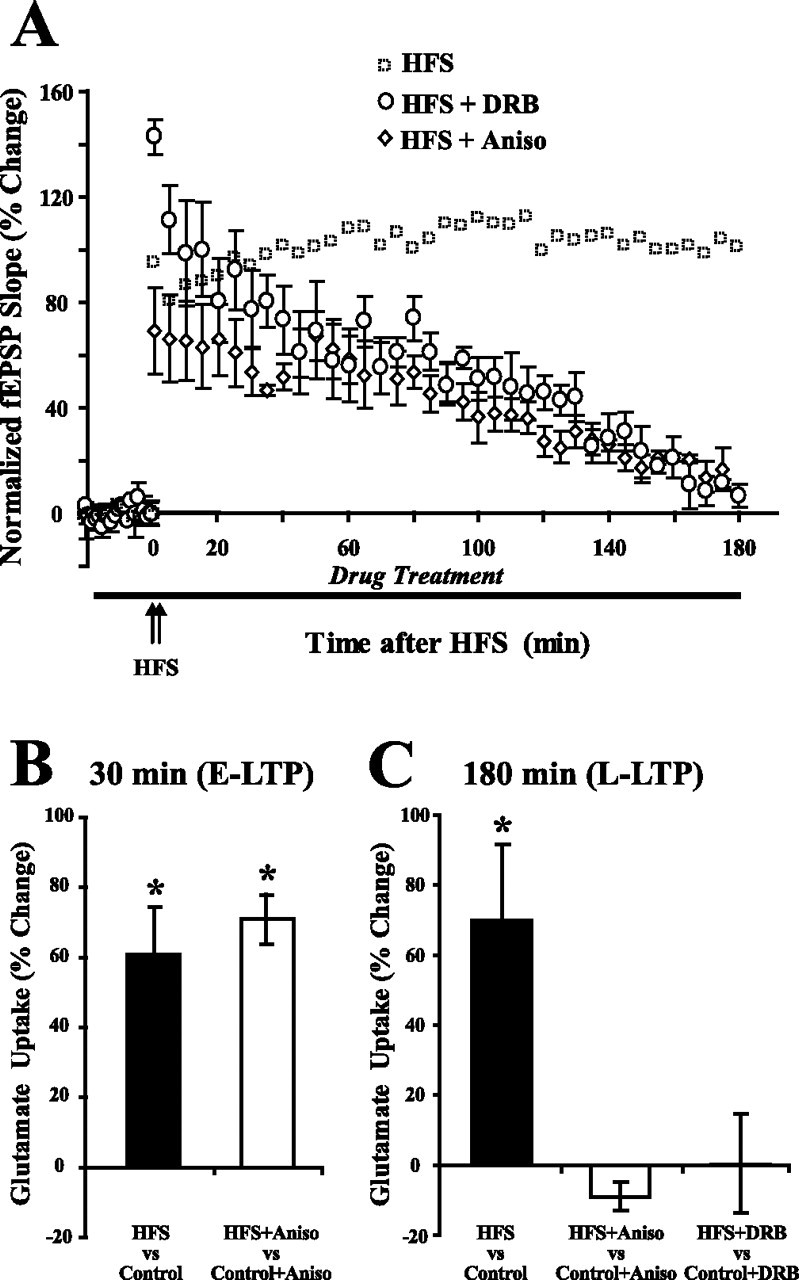
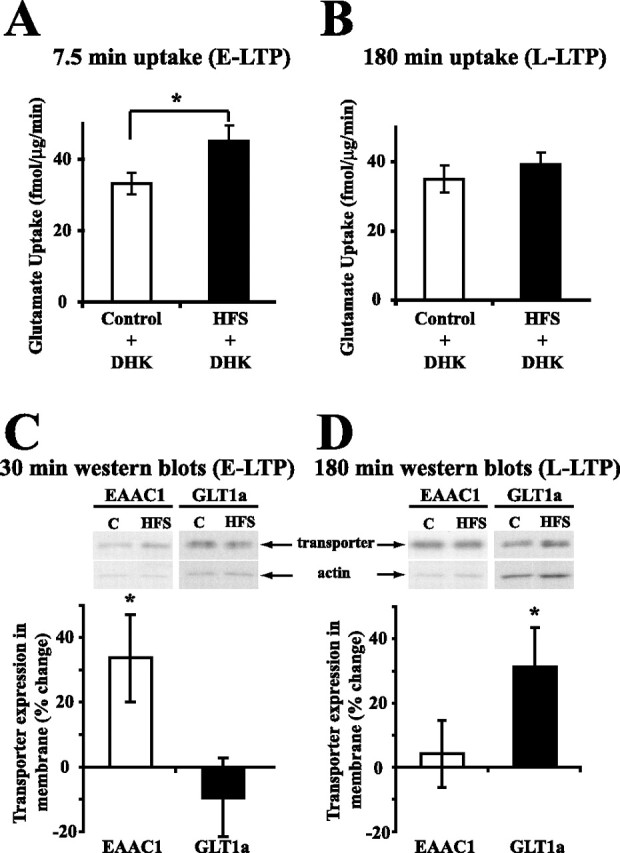
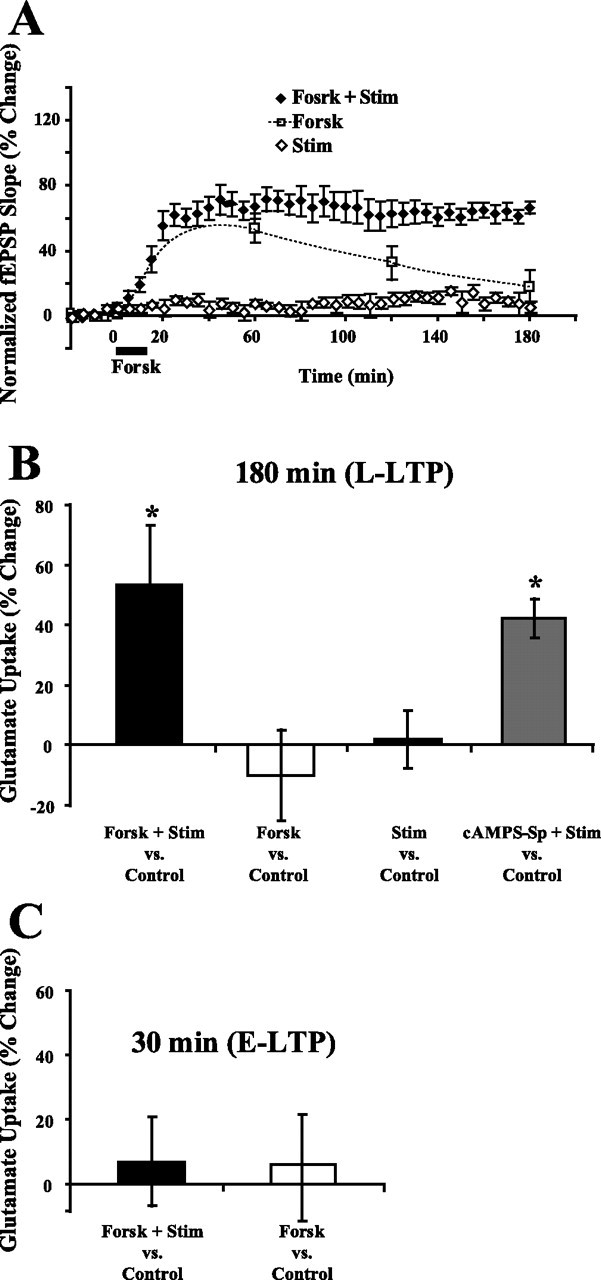
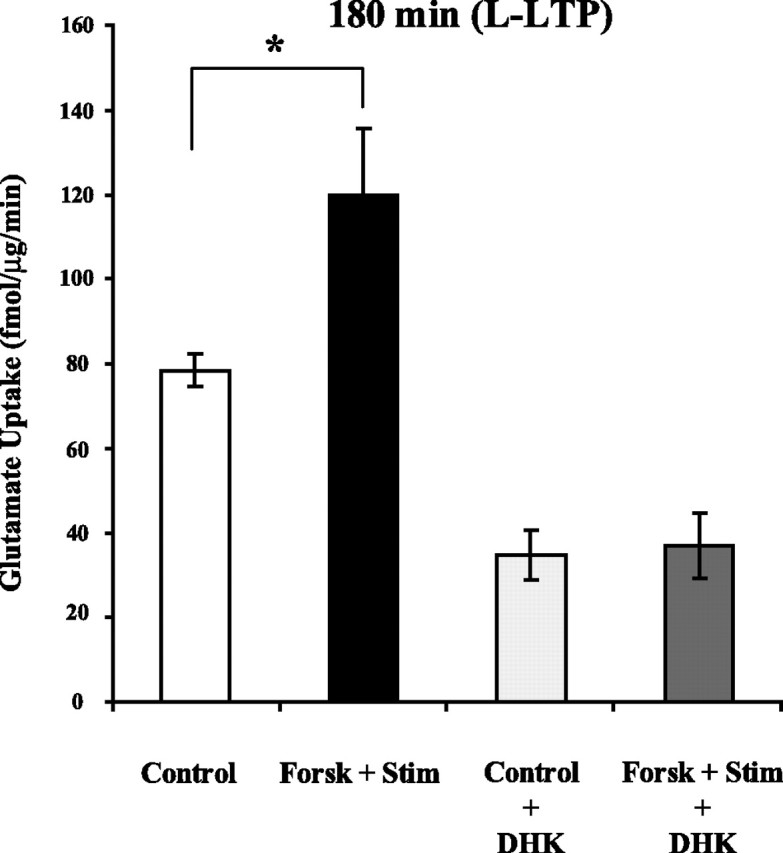
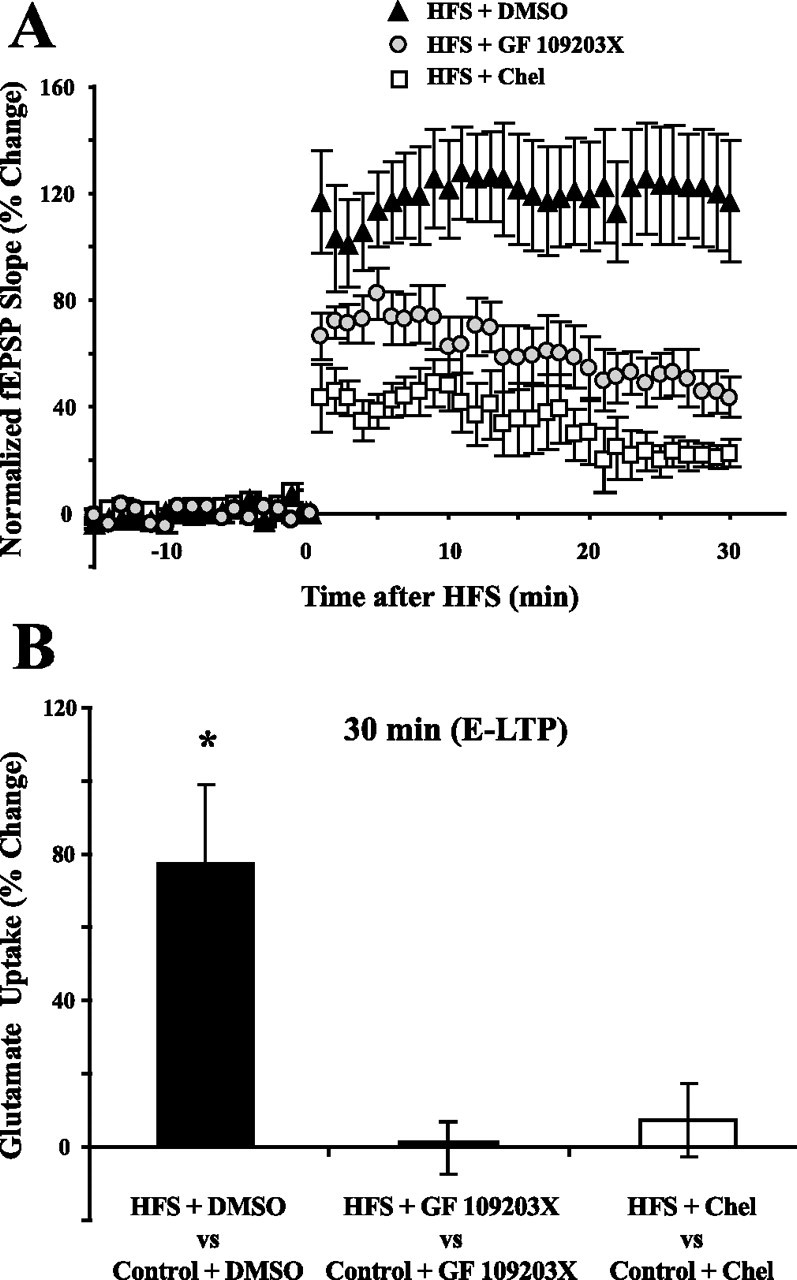
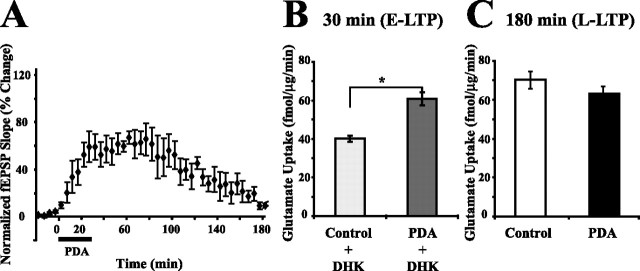
Regulation of glutamate reuptake occurs along with several forms of synaptic plasticity. These associations led to the hypothesis that regulation of glutamate uptake is a general component of plasticity at glutamatergic synapses. We tested this hypothesis by determining whether glutamate uptake is regulated during both the early phases (E-LTP) and late phases (L-LTP) of long-term potentiation (LTP). We found that glutamate uptake was rapidly increased within minutes after induction of LTP and that the increase in glutamate uptake persisted for at least 3 h in CA1 of the hippocampus. NMDA receptor activation and Na+-dependent high-affinity glutamate transporters were responsible for the regulation of glutamate uptake during all phases of LTP. However, different mechanisms appear to be responsible for the increase in glutamate uptake during E-LTP and L-LTP. The increase in glutamate uptake observed during E-LTP did not require new protein synthesis, was mediated by PKC but not cAMP, and as previously shown was attributable to EAAC1 (excitatory amino acid carrier-1), a neuronal glutamate transporter. On the other hand, the increase in glutamate uptake during L-LTP required new protein synthesis and was mediated by the cAMP-PKA (protein kinase A) pathway, and it involved a different glutamate transporter, GLT1a (glutamate transporter subtype 1a). The switch in mechanisms regulating glutamate uptake between E-LTP and L-LTP paralleled the differences in the mechanisms responsible for the induction of E-LTP and L-LTP. Moreover, the differences in signaling pathways and transporters involved in regulating glutamate uptake during E-LTP and L-LTP indicate that different functions and/or sites may exist for the changes in glutamate uptake during E-LTP and L-LTP.


Figures

Figure 1.
Figure 1.
Glutamate uptake is increased during all phases of LTP. A, An example of LTP produced by HFS is shown at the bottom. Baseline fEPSP recording 10 min before HFS and LTP fEPSP recording 30 min after HFS are shown. The dashed line shows the area of CA1 in which glutamate uptake was measured in the hippocampal slice. DG, Dentate gyrus; sc, Schaffer collaterals. B, LTP was induced using HFS (two 100 Hz, 1 s stimulations; 20 s apart) after a baseline recording period of 20 min. HFS produced LTP that lasted at least 180 min. The induction of LTP was blocked by the NMDA receptor blocker, APV (50 μm), administered during baseline recording and HFS (n = 4). fEPSPs were followed until determination of glutamate uptake at the times shown by a, b, c, and d in the figure. For the 2.5 (a) and 7.5 min (b) time points, only posttetanic potentiation was verified by test stimulation. For the 30 min (c) time point, maintenance of potentiation was verified each minute, and for the 3 h (d) time point, potentiation was verified every 5 min. Values are mean ± SEM (n = 5 rats). C, Glutamate uptake was measured in area CA1 of the hippocampus. The letters refer to times shown in B. Significant increases in glutamate uptake occurred as early as 2.5 min after HFS (a) and as late as 180 min after HFS (d). APV (50 μm) administered during baseline and HFS inhibited the increase in glutamate uptake at each time point. Open squares are slices that were treated with APV during baseline recording and HFS. Data were analyzed using a two-way ANOVA (F(1,43) = 27.6, p < 0.001 for the effect of treatment; F(3,43) = 3.3, p < 0.05 for the effect of time; F(3,43) = 0.5, p = 0.67 for the interaction between treatment and time). Error bars indicate SEM.
Figure 2.
Figure 2.
The increase in glutamate uptake during E-LTP and L-LTP is mediated by a Na+-dependent high-affinity glutamate transporter. HFS produced a significant increase in glutamate uptake 7.5 min (A) and 180 min (B) after HFS. TBOA (100 μm), a selective inhibitor of high-affinity glutamate transporters, or Na+ removal during measurement of glutamate uptake inhibited basal uptake as well as the increase in glutamate uptake observed 7.5 or 180 min after HFS. Data were analyzed using a one-way ANOVA (F(5,28) = 75.3, p < 0.001 for A; F(5,24) = 19.3, p < 0.001 for B), and post hoc analysis was done by Tukey–Kramer's test. *Statistically different, p < 0.05. Error bars indicate SEM.
Figure 3.
Figure 3.
Transcription and translation are required for the increase in glutamate uptake during L-LTP. A, A translation inhibitor, anisomycin (40 μm), or a transcription inhibitor, DRB (100 μm), was applied from 20 min before HFS to 180 min after HFS. RNA synthesis (DRB) or protein synthesis (anisomycin) inhibitors did not block the appearance of E-LTP but did block the appearance of L-LTP. Data for HFS alone (open boxes) were reproduced from Figure 1B. B, Anisomycin (40 μm) had no effect on the increase in glutamate uptake during E-LTP (30 min after HFS). Data for B were taken from Levenson et al. (2002). C, In contrast to 30 min after HFS, anisomycin (40 μm) or DRB (100 μm) blocked the increase in glutamate uptake 180 min after HFS. Anisomycin or DRB given alone for 180 min had no effect on the basal level of glutamate uptake (data not shown). Data were analyzed using a one-way ANOVA (F(2,12) = 6.7, p < 0.05), and post hoc analysis was done by Tukey–Kramer's test. *Statistically different, p < 0.05. Error bars indicate SEM. Aniso, Anisomycin.
Figure 4.
Figure 4.
DHK, an inhibitor of GLT1, blocked the increase in glutamate uptake during L-LTP, and HFS increased the level of GLT1a during L-LTP. A, B, DHK (500 μm) was applied to control and potentiated slices during measurement of glutamate uptake. DHK is an inhibitor of GLT1 isoforms. DHK decreased basal (control) uptake >50% in control slices in A and B (compare with controls of Fig. 2A,B). The increase in glutamate uptake during E-LTP (A) (n = 7) was not blocked by DHK, but DHK did block the increase in glutamate uptake during L-LTP (B) (n = 6). Data were analyzed using a two-tailed paired t test (t = 6.4, p < 0.01 in A; and t = 1.0, p = 0.37 in B). C, D, Representative Western blots of transporter protein from membrane fractions are shown above the summary of results obtained from densitometry. During E-LTP (30 min), a significant increase in the level of EAAC1 (t = 2.5; p < 0.05; n = 9) was produced by HFS, but no significant increase in the level of GLT1a (t = 0.8; p = 0.46; n = 7) was produced (C). During L-LTP (180 min), the level of GLT1a was significantly increased (t = 2.6; p < 0.05; n = 10) by HFS, but no significant increase in the level of EAAC1 (t = 0.4; p = 0.70; n = 9) was produced (D). Data were analyzed using one-sample t test. C, Control slices; HFS, slices receiving HFS. *Statistically different, p < 0.05. Error bars indicate SEM.
Figure 5.
Figure 5.
Elevating cAMP induced an increase in glutamate uptake during L-LTP. A, Forskolin (50 μm) was applied for 15 min after 20 min baseline recording. L-LTP was observed 180 min after treatment in slices that received test stimulation during forskolin treatment (n = 7; closed diamonds). Synaptic stimulation has been shown before to be necessary for forskolin to elicit L-LTP (Otmakhov et al., 2004). Slices that received forskolin treatment and no test stimulation, showed a transient potentiation at 60 min but did not exhibit L-LTP at 180 min (n = 7; dashed line). Test stimulation by itself (open diamonds) did not induce E-LTP or L-LTP (n = 5). B, Treatment with forskolin or Sp-cAMPs plus test stimulation induced a significant increase in glutamate uptake during L-LTP. Forskolin or test stimulation alone did not induce an increase in glutamate uptake 180 min after treatment. Data were analyzed using a one-way ANOVA (F(3,21) = 5.1; p < 0.01), and post hoc analysis was done by Tukey–Kramer's test. C, Although forskolin alone or forskolin plus test stimulation induced E-LTP (A), glutamate uptake was not changed 30 min after forskolin or forskolin plus test stimulation treatments. *Statistically different, p < 0.05. Error bars indicate SEM. Forsk, Forskolin; Stim, test stimulation.
Figure 6.
Figure 6.
DHK blocked the increase in glutamate uptake during L-LTP induced by forskolin plus test stimulation. Glutamate uptake in slices was significantly increased 180 min after treatment with forskolin plus test stimulation. DHK (500 μm) applied during the measurement of glutamate uptake reduced basal glutamate uptake and inhibited the increase in glutamate uptake observed 180 min after treatment with forskolin plus test stimulation. Data were analyzed using a one-way ANOVA (F(3,20) = 16.5; p < 0.001), and post hoc analysis was done by Tukey–Kramer's test. *Statistically different, p < 0.05. Error bars indicate SEM. Forsk, Forskolin; Stim, test stimulation.
Figure 7.
Figure 7.
Inhibiting PKA activity blocked the increase in glutamate uptake during L-LTP. A, Two different inhibitors of PKA, KT5720 (1 μm; n = 5), and Rp-cAMPs (100 μm; n = 4), for 30 min starting 15 min before HFS, prevented the induction of L-LTP without affecting E-LTP. LTP data for HFS (open boxes) were taken from Figure 1B. B, KT5720 (1 μm) or Rp-cAMPs (100 μm) for 30 min starting 15 min before HFS blocked the increase in glutamate uptake observed 180 min after HFS. KT5720 or Rp-cAMPs treatments by themselves for 30 min had no effect on glutamate uptake. Data were analyzed using a one-way ANOVA (F(2,13) = 5.66; p < 0.05), and post hoc analysis was done by Tukey–Kramer's test. *Statistically different, p < 0.05. Error bars indicate SEM.
Figure 8.
Figure 8.
Inhibitors of PKC blocked the increase in glutamate uptake during E-LTP. A, Two different inhibitors of PKC, Chelerythrine (10 μm) and GF 109203X (0.5 μm), had inhibitory effects on the induction of E-LTP (n = 5). Chelerythrine and GF 109203X were applied from 15 min before HFS to 15 min after HFS. B, The two different PKC inhibitors applied during HFS blocked the increase in glutamate uptake observed 30 min after HFS (n = 5 for each inhibitor). Chelerythrine or GF 109203X treatments by themselves for 30 min had no effect on glutamate uptake measured 30 min later (data not shown). Data were analyzed using a one-way ANOVA (F(2,12) = 8.8; p < 0.01), and post hoc analysis was done by Tukey–Kramer's test. *Statistically different, p < 0.05. Error bars indicate SEM. Chel, Chelerythrine.
Figure 9.
Figure 9.
Phorbol ester, PDA, induced only a short-term increase in glutamate that was not blocked by DHK. A, PDA (3 μm), a phorbol ester that activates PKC, was given for 30 min after baseline recording (n = 6). PDA induced a transient potentiation. B, PDA induced a significant short-term increase in glutamate uptake during E-LTP, which was not blocked by DHK (500 μm) during measurement of glutamate uptake (t = 5.6; p < 0.01; n = 6). C, PDA (3 μm) given for 30 min after 20 min of baseline recording did not produce a long-term increase in glutamate uptake (t = 2.0; p = 0.09; n = 6). Data were analyzed using two-tailed paired t test. *Statistically different, p < 0.05. Error bars indicate SEM.

Similar articles

Cited by

References

    1. Abel T, Nguyen PV, Barad M, Deuel TA, Kandel ER, Bourtchouladze R. Genetic demonstration of a role for PKA in the late phase of LTP and in hippocampus-based long-term memory. Cell. 1997;88:615–626. - PubMed
    1. Arriza JL, Fairman WA, Wadiche JI, Murdoch GH, Kavanaugh MP, Amara SG. Functional comparisons of three glutamate transporter subtypes cloned from human motor cortex. J Neurosci. 1994;14:5559–5569. - PMC - PubMed
    1. Berger UV, DeSilva TM, Chen W, Rosenberg PA. Cellular and subcellular mRNA localization of glutamate transporter isoforms GLT1a and GLT1b in rat brain by in situ hybridization. J Comp Neurol. 2005;492:78–89. - PMC - PubMed
    1. Bliss TV, Collingridge GL. A synaptic model of memory: long-term potentiation in the hippocampus. Nature. 1993;361:31–39. - PubMed
    1. Cabell L, Audesirk G. Effects of selective inhibition of protein kinase C, cyclic AMP-dependent protein kinase, and Ca2+-calmodulin-dependent protein kinase on neurite development in cultured rat hippocampal neurons. Int J Dev Neurosci. 1993;11:357–368. - PubMed

Publication types