

A new paradigm: manganese superoxide dismutase influences the production of H2O2 in cells and thereby their biological state
- PMID: 17015180
- PMCID: PMC2443724
- DOI: 10.1016/j.freeradbiomed.2006.07.015
A new paradigm: manganese superoxide dismutase influences the production of H2O2 in cells and thereby their biological state
Abstract
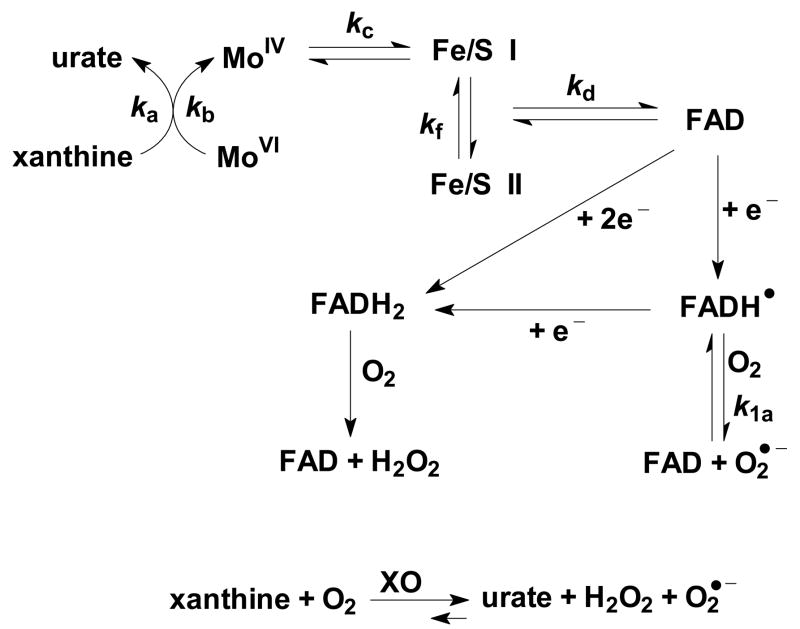
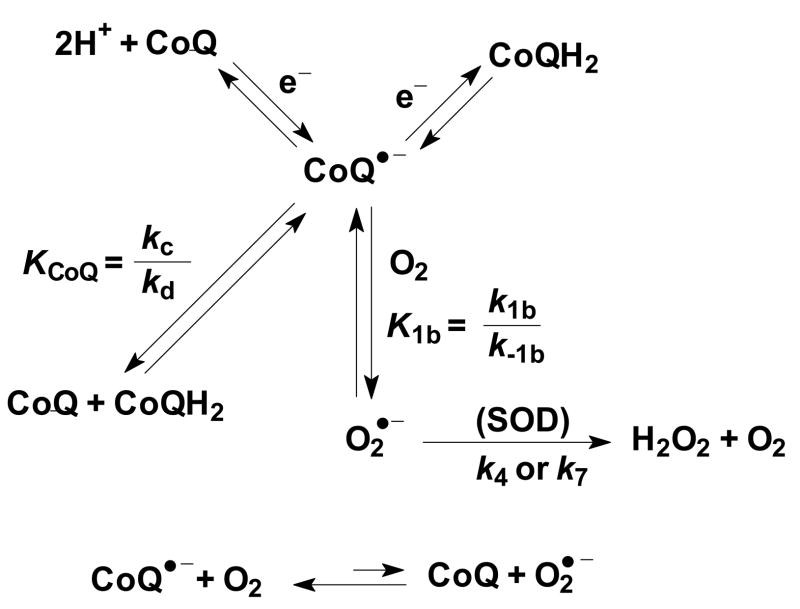
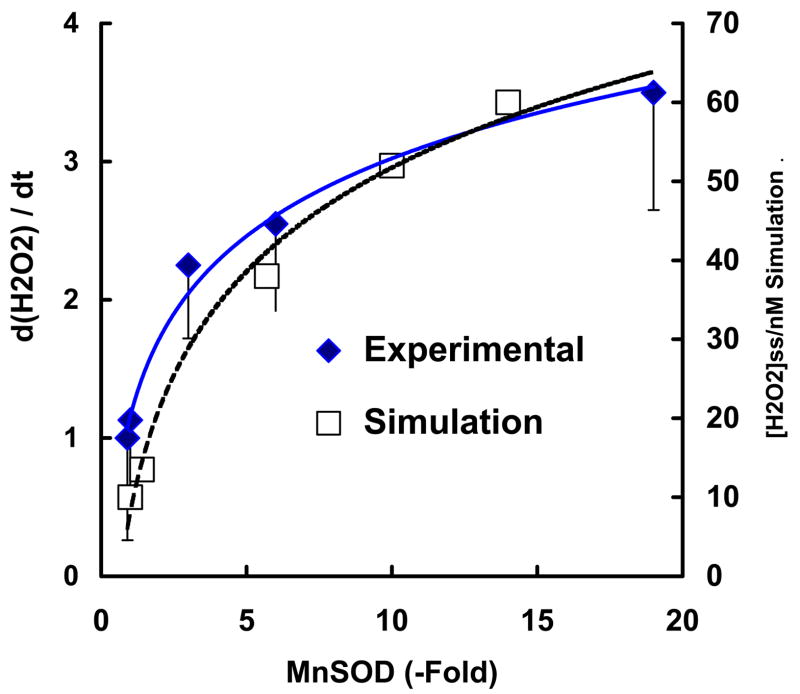
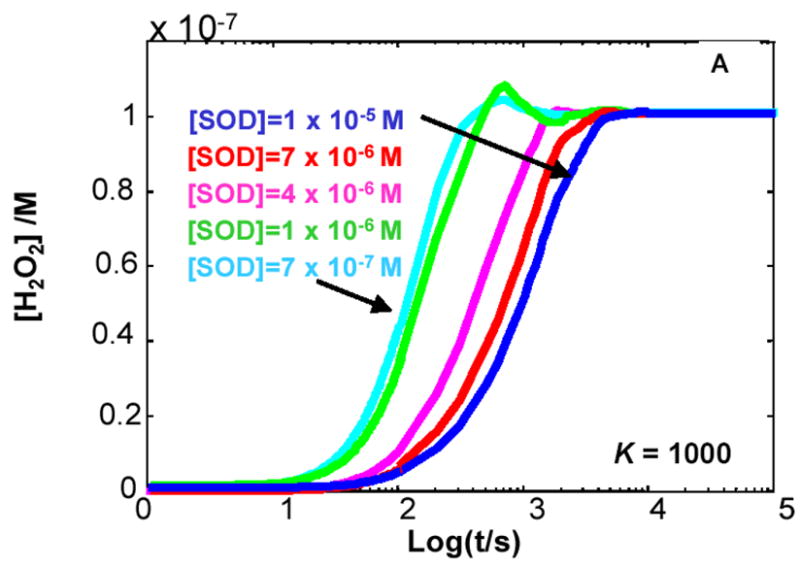
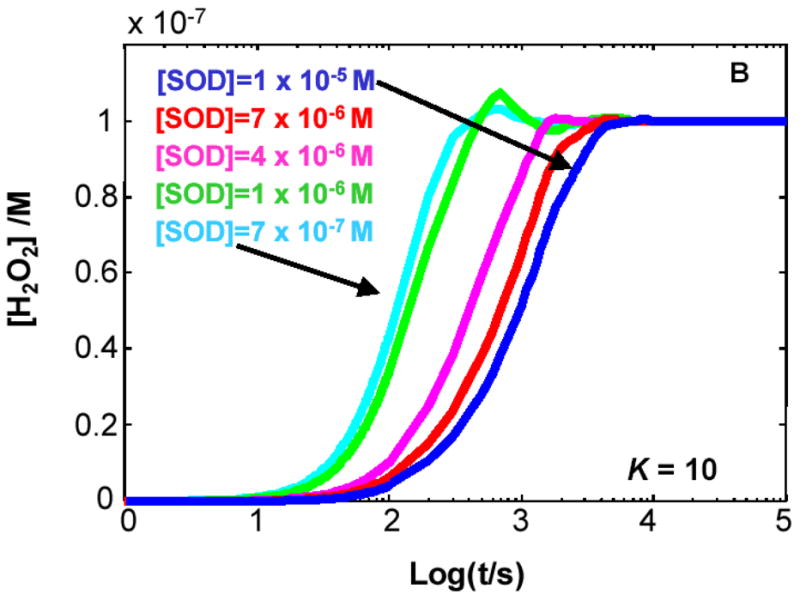
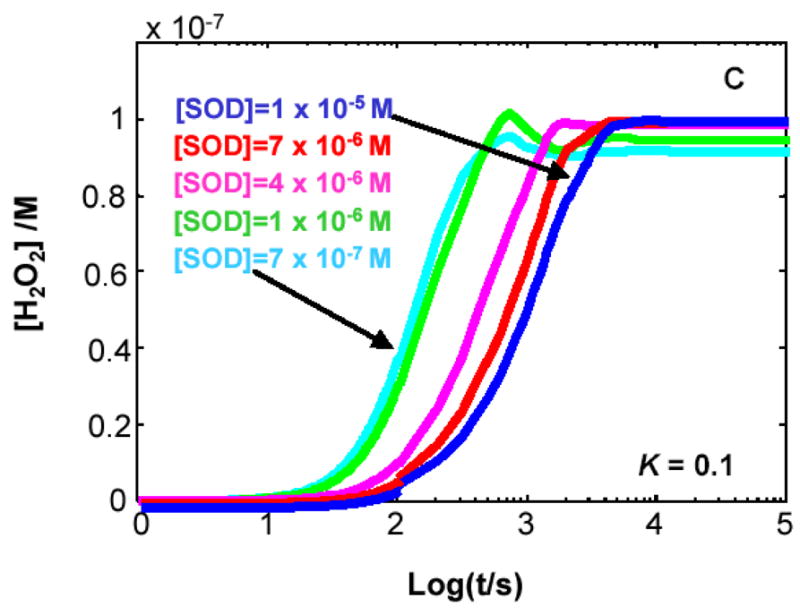
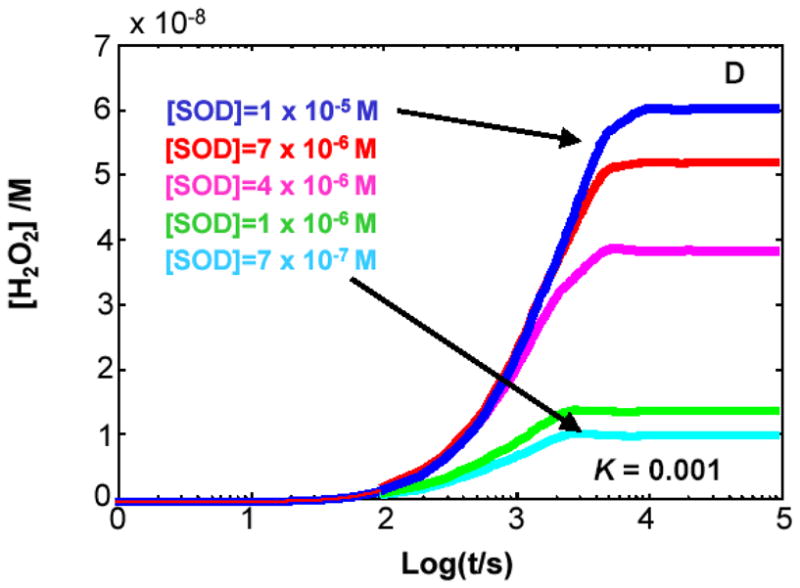
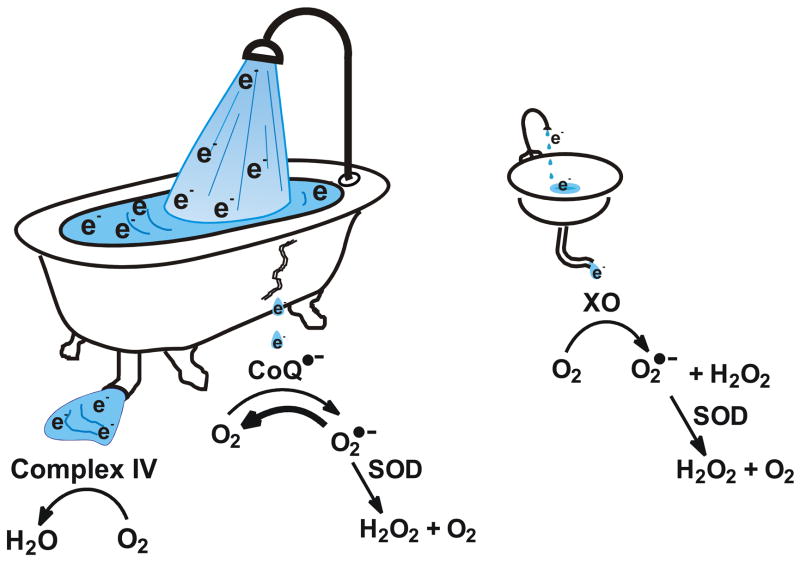
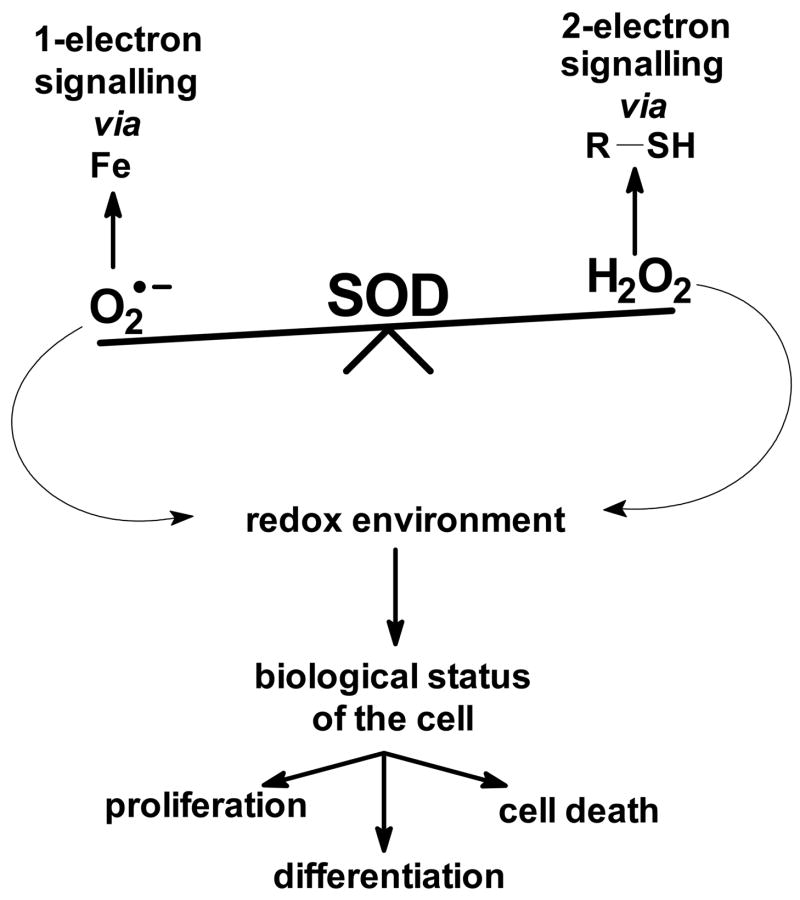
The principal source of hydrogen peroxide in mitochondria is thought to be from the dismutation of superoxide via the enzyme manganese superoxide dismutase (MnSOD). However, the nature of the effect of SOD on the cellular production of H(2)O(2) is not widely appreciated. The current paradigm is that the presence of SOD results in a lower level of H(2)O(2) because it would prevent the non-enzymatic reactions of superoxide that form H(2)O(2). The goal of this work was to: a) demonstrate that SOD can increase the flux of H(2)O(2), and b) use kinetic modelling to determine what kinetic and thermodynamic conditions result in SOD increasing the flux of H(2)O(2). We examined two biological sources of superoxide production (xanthine oxidase and coenzyme Q semiquinone, CoQ(*-) that have different thermodynamic and kinetic properties. We found that SOD could change the rate of formation of H(2)O(2) in cases where equilibrium-specific reactions form superoxide with an equilibrium constant (K) less than 1. An example is the formation of superoxide in the electron transport chain (ETC) of the mitochondria by the reaction of ubisemiquinone radical with dioxygen. We measured the rate of release of H(2)O(2) into culture medium from cells with differing levels of MnSOD. We found that the higher the level of SOD, the greater the rate of accumulation of H(2)O(2). Results with kinetic modelling were consistent with this observation; the steady-state level of H(2)O(2) increases if K<1, for example CoQ(*-)+O(2)-->CoQ+O(2)(*-). However, when K>1, e.g. xanthine oxidase forming O(2)(*-), SOD does not affect the steady state-level of H(2)O(2). Thus, the current paradigm that SOD will lower the flux of H(2)O(2) does not hold for the ETC. These observations indicate that MnSOD contributes to the flux of H(2)O(2) in cells and thereby is involved in establishing the cellular redox environment and thus the biological state of the cell.
Figures
Similar articles
-
Why does SOD overexpression sometimes enhance, sometimes decrease, hydrogen peroxide production? A minimalist explanation.Free Radic Biol Med. 2002 Jun 15;32(12):1351-7. doi: 10.1016/s0891-5849(02)00861-4. Free Radic Biol Med. 2002. PMID: 12057773
-
Superoxide dismutase in redox biology: the roles of superoxide and hydrogen peroxide.Anticancer Agents Med Chem. 2011 May 1;11(4):341-6. doi: 10.2174/187152011795677544. Anticancer Agents Med Chem. 2011. PMID: 21453242 Free PMC article. Review.
-
The pro-oxidative activity of SOD and nitroxide SOD mimics.FASEB J. 2000 Jun;14(9):1215-23. doi: 10.1096/fasebj.14.9.1215. FASEB J. 2000. PMID: 10834943
-
H2O2 release from human granulocytes during phagocytosis. Relationship to superoxide anion formation and cellular catabolism of H2O2: studies with normal and cytochalasin B-treated cells.J Clin Invest. 1977 Dec;60(6):1266-79. doi: 10.1172/JCI108886. J Clin Invest. 1977. PMID: 199619 Free PMC article.
-
Thermodynamic and kinetic considerations for the reaction of semiquinone radicals to form superoxide and hydrogen peroxide.Free Radic Biol Med. 2010 Sep 15;49(6):919-62. doi: 10.1016/j.freeradbiomed.2010.05.009. Epub 2010 May 21. Free Radic Biol Med. 2010. PMID: 20493944 Free PMC article. Review.
Cited by
-
Mechanistic Understanding of D-Glucaric Acid to Support Liver Detoxification Essential to Muscle Health Using a Computational Systems Biology Approach.Nutrients. 2023 Feb 1;15(3):733. doi: 10.3390/nu15030733. Nutrients. 2023. PMID: 36771439 Free PMC article.
-
Inactivation of anthracyclines by serum heme proteins.Chem Res Toxicol. 2007 Jun;20(6):920-6. doi: 10.1021/tx700002f. Epub 2007 May 12. Chem Res Toxicol. 2007. PMID: 17497896 Free PMC article.
-
Redox control of the cell cycle in health and disease.Antioxid Redox Signal. 2009 Dec;11(12):2985-3011. doi: 10.1089/ars.2009.2513. Antioxid Redox Signal. 2009. PMID: 19505186 Free PMC article. Review.
-
Xanthine oxidase-derived ROS upregulate Egr-1 via ERK1/2 in PA smooth muscle cells; model to test impact of extracellular ROS in chronic hypoxia.PLoS One. 2011;6(11):e27531. doi: 10.1371/journal.pone.0027531. Epub 2011 Nov 28. PLoS One. 2011. PMID: 22140445 Free PMC article.
-
Metabolic Features of Brain Function with Relevance to Clinical Features of Alzheimer and Parkinson Diseases.Molecules. 2022 Jan 30;27(3):951. doi: 10.3390/molecules27030951. Molecules. 2022. PMID: 35164216 Free PMC article. Review.
References
-
- Fridovich I. Superoxide radical and superoxide dismutases. Annual Review of Biochemistry. 1995;64:97–112. - PubMed
-
- Fridovich I. Superoxide dismutases. An adaptation to a paramagnetic gas. J Biol Chem. 1989;264:7761–7764. - PubMed
-
- Klug D, Rabani J, Fridovich I. A direct demonstration of the catalytic action of superoxide dismutase through the use of pulse radiolysis. J Biol Chem. 1972;247:4839–4842. - PubMed
-
- Klug-Roth D, Fridovich I, Rabani J. Pulse radiolytic investigations of superoxide catalyzed disproportionation. Mechanism for bovine superoxide dismutase. J Am Chem Soc. 1973;95:2786–2790. - PubMed
-
- Bielski BHJ, Cabelli DE, Arudi RL, Ross; AB. Reactivity of hydroperoxyl/superoxide radicals in aqueous solution. J Phys Chem Ref Data. 1985;14:1041–1100.
Publication types
MeSH terms
Substances
Grants and funding
- R01 CA081090-02/CA/NCI NIH HHS/United States
- CA66081/CA/NCI NIH HHS/United States
- P01 CA066081-029001/CA/NCI NIH HHS/United States
- P01 CA066081-05A29001/CA/NCI NIH HHS/United States
- CA81090/CA/NCI NIH HHS/United States
- R01 CA081090-03/CA/NCI NIH HHS/United States
- R01 CA081090-01/CA/NCI NIH HHS/United States
- P01 CA066081-060003/CA/NCI NIH HHS/United States
- P01 CA066081-049001/CA/NCI NIH HHS/United States
- P01 CA066081/CA/NCI NIH HHS/United States
- P01 CA066081-069001/CA/NCI NIH HHS/United States
- R01 CA081090-04/CA/NCI NIH HHS/United States
- P01 CA066081-039001/CA/NCI NIH HHS/United States
LinkOut - more resources
Full Text Sources
Other Literature Sources
