Comparative Study
. 2006 Sep 20;26(38):9722-35.
doi: 10.1523/JNEUROSCI.1716-06.2006.

Identification of Sox17 as a transcription factor that regulates oligodendrocyte development

Affiliations
Comparative Study

Identification of Sox17 as a transcription factor that regulates oligodendrocyte development

Jiho Sohn et al. J Neurosci. .

Abstract

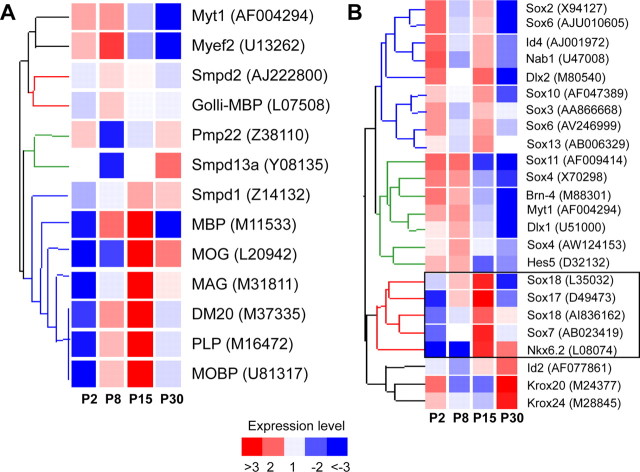
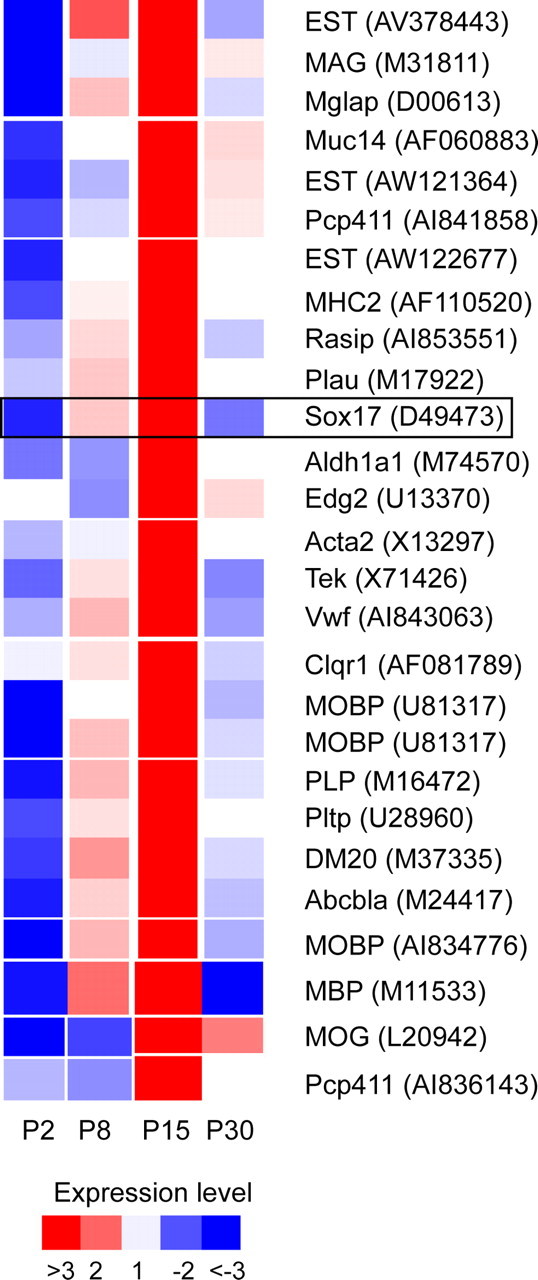
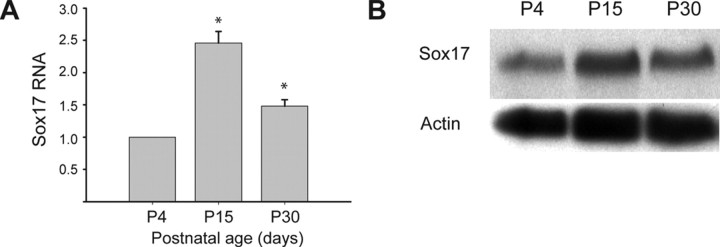
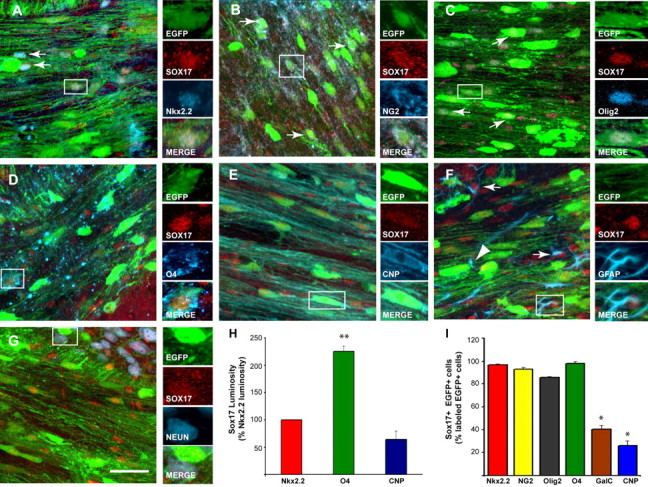
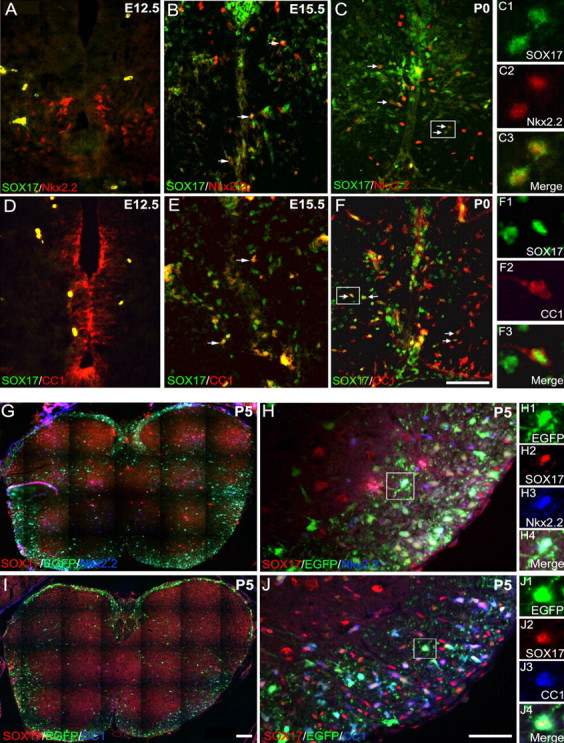
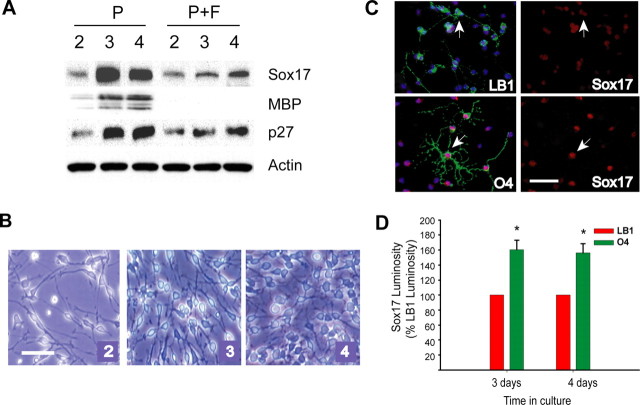
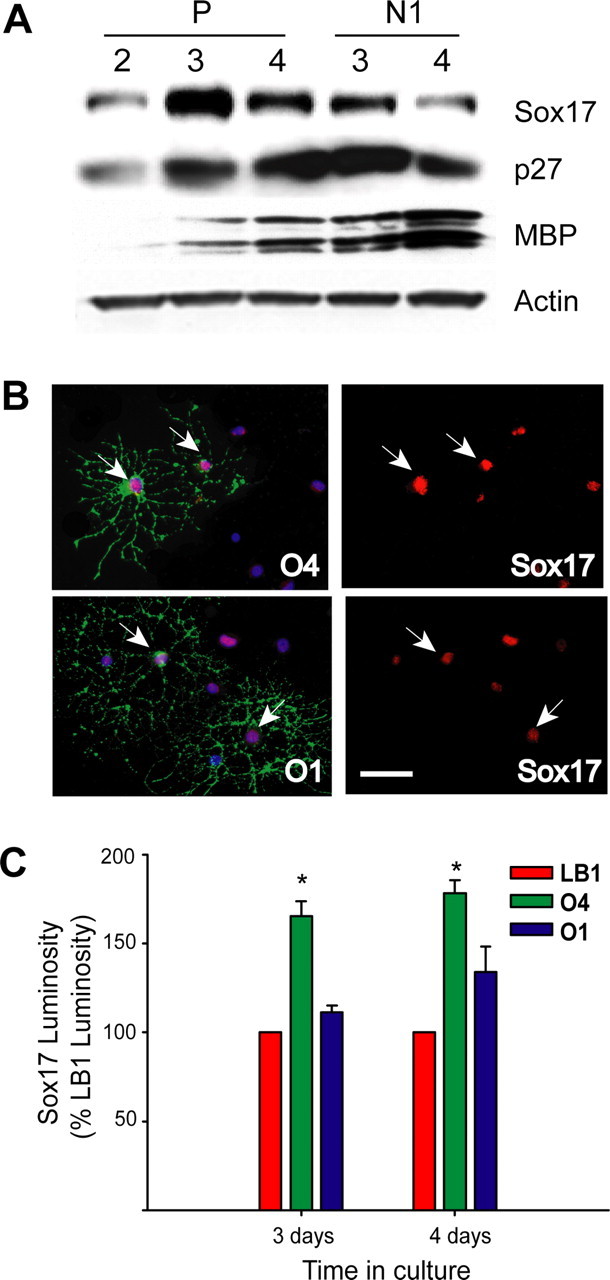
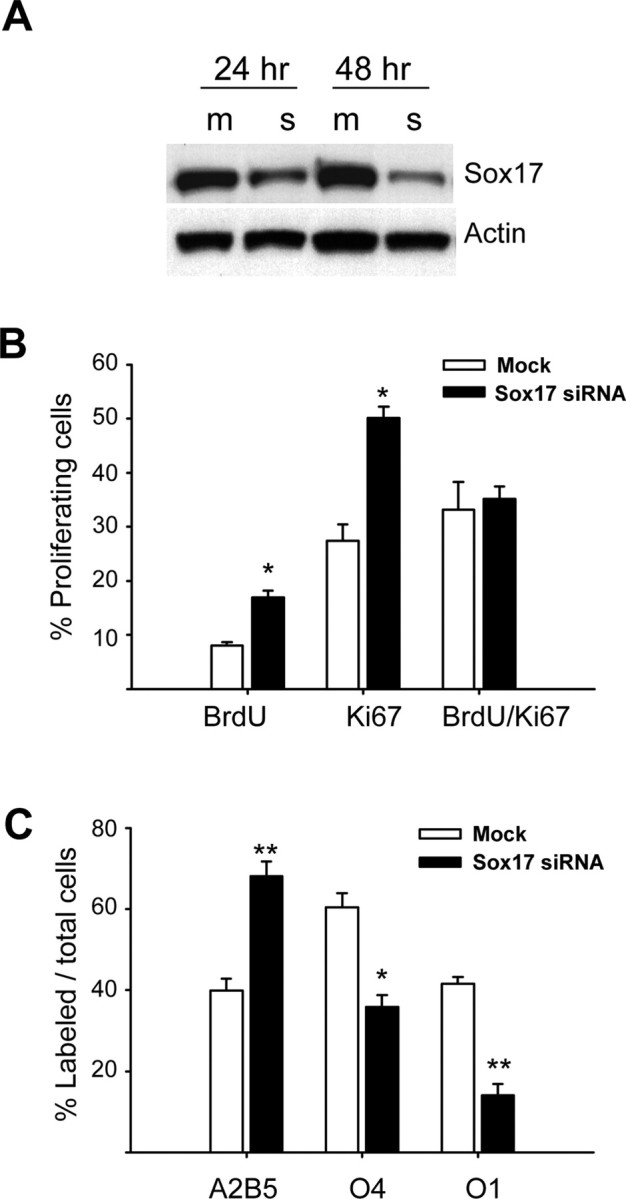
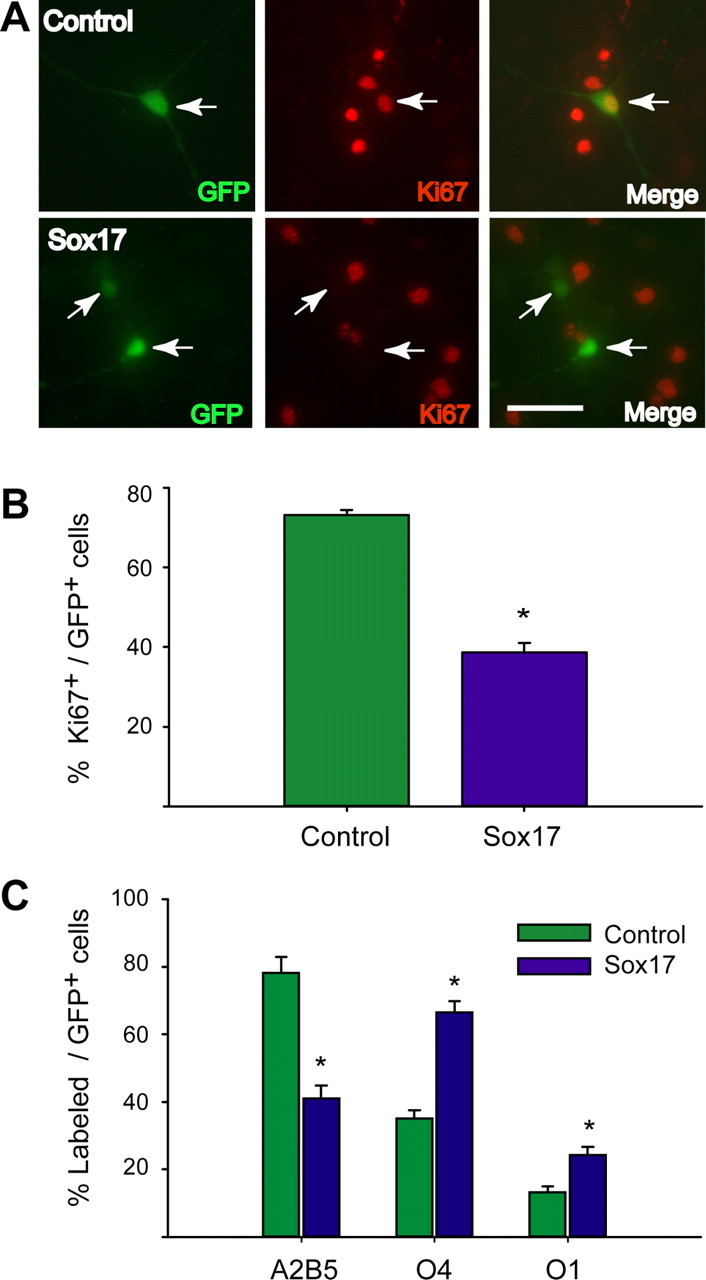
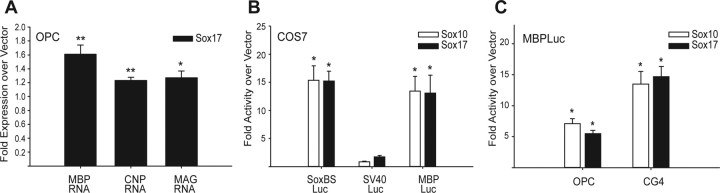
Microarray analysis of oligodendrocyte lineage cells purified by fluorescence-activated cell sorting (FACS) from 2',3'-cyclic nucleotide 3'-phosphodiesterase (CNP)-enhanced green fluorescent protein (EGFP) transgenic mice revealed Sox17 (SRY-box containing gene 17) gene expression to be coordinately regulated with that of four myelin genes during postnatal development. In CNP-EGFP-positive (CNP-EGFP+) cells, Sox17 mRNA and protein levels transiently increased between postnatal days 2 and 15, with white matter O4+ preoligodendrocytes expressing greater Sox17 levels than Nkx2.2+ (NK2 transcription factor related, locus 2) NG2+, or GalC+ (galactocerebroside) cells. In spinal cord, Sox17 protein expression was undetectable in the primary motor neuron domain between embryonic days 12.5 and 15.5 but was evident in Nkx2.2+ and CC1+ cells. In cultured oligodendrocyte progenitor cells (OPCs), Sox17 levels were maximal in O4+ cells and peaked during the phenotypic conversion from bipolar to multipolar. Parallel increases in Sox17 and p27 occurred before MBP protein expression, and Sox17 upregulation was prevented by conditions inhibiting differentiation. Sox17 downregulation with small interfering RNAs increased OPC proliferation and decreased lineage progression after mitogen withdrawal, whereas Sox17 overexpression in the presence of mitogen had opposite effects. Sox17 overexpression enhanced myelin gene expression in OPCs and directly stimulated MBP gene promoter activity. These findings support important roles for Sox17 in controlling both oligodendrocyte progenitor cell cycle exit and differentiation.


Figures

Figure 1.
Figure 1.
Developmental expression of myelin-associated genes and transcription factors in FACS-isolated oligodendrocyte lineage cells. CNP–EGFP+ cells were isolated from whole mouse brain at P2, P8, P15, and P30 using FACS. A, Hierarchical clustering of transcripts (standard correlation) from the FACS-isolated oligodendrocyte lineage cells identified four expression patterns (colored branches) reflecting the known timing of myelin-associated gene expression in vivo. B, Hierarchical clustering of transcripts (standard correlation) from the FACS-isolated CNP–EGFP+ cells identified four major groups of transcription factors based on the timing of gene regulation (colored branches). The red branch contains all members of the Sox family subgroup F (black box). Each mRNA was normalized to the median expression level across all probe sets and all chips. Legend shows the color code for mRNA expression levels (red, upregulation; blue, downregulation). Gene symbol and GenBank accession numbers are listed on right side.
Figure 2.
Figure 2.
Coordinate clustering using myelin genes identifies Sox17 as a candidate regulator of oligodendrocyte development. Gene tree containing 27 mRNAs with an expression pattern highly correlated (Pearson's correlation, r = 0.97) with the expression of MAG, MOG, PLP, and its splice variant DM20 in CNP–EGFP+ cells. Each mRNA was normalized to the median expression level across all probe sets and all chips in this experiment. Legend shows the color code for mRNA expression levels (red, upregulation; blue, downregulation). Gene symbol and GenBank accession numbers are listed on right side.
Figure 3.
Figure 3.
Developmental expression and regulation of Sox17 mRNA and protein in the oligodendrocyte lineage ex vivo. FACS-purified CNP–EGFP+ cells were collected at different developmental stages (P4–P30), and mRNA or total protein were analyzed for Sox 17 expression by RT-qPCR (A) and Western blot (B). A, The developmental pattern of Sox 17 expression was confirmed by RT-qPCR analysis, which showed a 2.5-fold increase between P4 and P15, followed by a decrease between P15 and P30 (levels at P30 showed a 1.5-fold increase compared with P4). Values for Sox17 expression are normalized to actin mRNA expression. Data shown are averages ± SEM of three independent experiments. *p < 0.005 compared with P4. B, Western blot analysis for Sox17 and actin proteins at P4, P15, and P30. Normalized densitometric readings show that Sox17 is increased twofold at P15 and decreased to 1.47-fold at P30 relative to P4 values.
Figure 4.
Figure 4.
Immunohistochemical analysis of Sox17 expression in the white matter. Sox17 expression was analyzed in the SCWM of the CNP–EGFP mouse at P15. A, Nkx2.2+ (blue)–EGFP+ (green) OPCs express Sox17 (red). B, NG2+(blue)–EGFP+(green) oligodendrocyte progenitors also express Sox17 (red). In both Nkx2.2+ and NG2+ progenitors, Sox17 immunoreactivity displays a diffused distribution. C, Olig2+(blue)–EGFP+(green) oligodendrocyte lineage cells express Sox17 (red). D, In O4+ (blue)–EGFP+(green) cells, Sox17 immunolabeling (red) was less diffuse and displayed a more intense and nuclear pattern than in Nkx2.2+ and NG2+ cells. E, Sox17 (red) was not nuclear in CNP+(blue)–EGFP+ (green) cells. Arrows in A–C indicate triple-labeled cells (green/red/blue), whereas cells shown in the small panels are enlarged from respective boxed areas. Scale bar, 50 μm. F, Sox17 is detectable in some GFAP+ astrocytes (box and arrows) and absent from others (arrowhead) in white matter. G, NeuN+ neurons (blue) are EGFP negative (green) and express uniformly low levels of Sox17 (red). H, Luminosity measurements of oligodendrocyte lineage cells immunostained with anti-Sox17 antibodies and developmental markers show that O4+ cells express significantly higher levels of Sox17 than Nkx2.2+ and CNP+ cells. Data are presented as a percentage of Sox17 luminosity in Nkx2.2+ cells. Averages ± SEM were obtained from a total of 85–136 cells analyzed for each antibody marker. **p < 0.03, Student's t test versus Nkx2.2. I, Numbers of triple-labeled Sox17+–EGFP+ cells in P15 SCWM, expressed as a percentage of EGFP+ cells labeled with each oligodendrocyte lineage marker. The total number of cells analyzed ranged between 520 and 872 for each antibody marker. *p < 0.01 (compared with Nkx2.2 cells).
Figure 5.
Figure 5.
Regulation of Sox17 expression in spinal cord. Sox17 expression was analyzed in embryonic and postnatal spinal cord of wild-type (E12.5, E15.5, and P0; A–F) and CNP–EGFP (P5; G–J) mice. A–C, Nkx2.2+ (red) OPCs express Sox17 (green) at E15.5 and P0. Importantly, Sox17 is not expressed in the pMN or p3 domains. D–F, Sox17 (green) was also detected in CC1+ (red) cells. Arrows indicate colocalization of Sox17 with Nkx2.2 or CC1. G–J, In the CNP–EGFP mouse, Sox17 (red) expression was detected in both Nkx2.2+(blue)–EGFP+(green) cells (G, H) and in CC1+(blue)–EGFP+(green) cells (I, J). Cells shown in small panels (C1–C3, F1–F3, H1–H4, and J1–J4) are enlarged from respective boxed areas. Scale bars, 50 μm.
Figure 6.
Figure 6.
Regulation of Sox17 protein expression in proliferating oligodendrocyte progenitors in culture. A, Representative Western blot comparing Sox17, p27, and MBP expression and regulation in OPCs maintained in PDGF (P; 10 ng/ml) or in PDGF plus bFGF (P+F; both at 10 ng/ml) for 2–4 d. The increase in Sox17 expression observed in cells cultured in PDGF was not observed in cells cultured in PDGF plus bFGF. B, Images of living OPCs at 2, 3, and 4 d of culture in PDGF, showing morphological changes between days 2 and 4 in vitro. Scale bar, 1 mm. C, Purified oligodendrocyte lineage cells at different developmental stages were identified using specific markers. OPCs were exposed to PDGF for 4 d. The top left panel shows merged images of surface marker LB1 in green, nuclear DNA stained with DAPI in blue, and Sox17 immunoreactivity in red. The bottom left panel shows merged images of surface marker O4 in green, nuclear DNA stained with DAPI in blue, and Sox17 immunoreactivity in red. The right panels show Sox17 immunostaining alone, with arrows that indicate representative LB1+ and O4+ cells in corresponding fields. Exposure times were standardized at image acquisition. Scale bar, 50 μm. D, Sox17 luminosity measurements of LB1+ and O4+ cells at each time point expressed as a percentage of Sox17 luminosity in LB1+ cells at the same time points. OPCs with PDGF (10 ng/ml) were analyzed by double immunostaining at 3 and 4 d in culture. Sox17 luminosity was significantly higher in O4+ than in LB1+ cells at both 3 and 4 d in culture. Results are expressed as mean ± SEM of four experiments, with total numbers of cells counted ranging between 98 and 211 for each antibody. *p < 0.01, Student's t test.
Figure 7.
Figure 7.
Regulation of Sox17 protein expression in differentiating oligodendrocyte progenitors in culture. A, Western blot data comparing Sox17 expression and regulation in OPCs maintained in PDGF (P; 10 ng/ml) or in the absence of mitogens (DME–N1). Cells were maintained in PDGF for 2 d, followed by either 2 more days in PDGF or N1–PDGF-free medium. The increase in Sox17 expression observed in cells cultured in PDGF was higher than in cells cultured in DME–N1. B, Purified oligodendrocyte lineage cells at different developmental stages were identified using specific markers. OPCs were exposed to PDGF for 2 d, followed by 2 d in N1–PDGF-free medium. The top left panel shows merged images of surface markers O4 in green, nuclear DNA stained with DAPI in blue, and Sox17 immunoreactivity in red. The bottom panel shows merged images of surface markers O1 in green, nuclear DNA stained with DAPI in blue, and Sox17 immunoreactivity in red. The right panels show Sox17 immunostaining alone, with arrows that indicate representative O4+ and O1+ cells in corresponding fields. Exposure times were standardized at image acquisition. Scale bar, 50 μm. C, Sox17 luminosity measurements in LB1+, O4+, and O1+ cells expressed as a percentage of Sox17 levels in LB1+ cells at the same time points. OPCs treated as in A (N1 medium) were analyzed by double immunostaining at 3 and 4 d in culture. Sox17 luminosity was significantly higher in O4+ than in LB1+ or O1+ cells at both 3 and 4 d in culture. Results are expressed as mean ± SEM of three experiments, with total numbers of cells counted ranging between 44 and 118 for each antibody. *p ≤ 0.05, Student's t test.
Figure 8.
Figure 8.
Sox17 loss-of-function reveals a role in cell cycle exit and differentiation. Purified OPCs were cultured in the presence of PDGF (10 ng/ml) and transfected with Sox 17 siRNAs. A, Representative Western blot of Sox 17 protein levels shows a 60 and 80% reduction in Sox 17 expression at 24 and 48 h after transfection in PDGF, respectively. Numbers indicate hours after transfection. m, Mock transfected with scrambled sequence; s, Sox17 siRNA transfected. B, Downregulation of Sox17 expression induces an increase in OPC proliferation, as measured by anti-Ki67 and anti-BrdU staining (3 d after transfection). Cells were incubated with BrdU (20 μm) for 1.5 h before staining. Values represent percentage of total cells, as determined by DAPI counterstaining. Results are expressed as mean ± SEM of three to four experiments with a total number of cells counted ranging between 1475 and 2174 for each antibody. *p ≤ 0.005 (compared with mock-transfected cells), Student's t test. C, Downregulation of Sox 17 expression prevents OPC lineage progression, as determined by A2B5 and O4 (3 d after transfection) and O1 immunostaining (5 d after transfection). Values represent percentage of total cells, as determined by DAPI counterstaining. Results are expressed as mean ± SEM of three to four experiments with total numbers of cells counted ranging between 1381 and 1630 for each antibody. *p < 0.01 and **p ≤ 0.005 (compared with mock-transfected cells), Student's t test.
Figure 9.
Figure 9.
Sox17 gain-of-function confirms a role in cell cycle exit and differentiation. Purified OPCs were cultured in the presence of PDGF (10 ng/ml) and transfected with pCMV–Sox17–IRES2–AcGFP or pCMV–IRES2–AcGFP. A, Example of anti-Ki67 staining (red fluorescence) in control (green fluorescence, top row) or Sox17-overexpressing (green fluorescence, bottom row) cells at 24 h after transfection in PDGF. Scale bar, 50 μm. B, Overexpression of Sox 17 expression induces a decrease in OPC proliferation, as measured by anti-Ki67 staining 24 h after transfection in PDGF. Values represent percentage of GFP+ cells. Results are expressed as mean ± SEM of three independent experiments with a total number of cells counted as 403 (Sox17) and 529 (control). *p ≤ 0.001 (compared with control), Student's t test. C, Sox 17 overexpression promotes OPC lineage progression, as determined by A2B5 and O4 (2 d after transfection) and O1 (3 d after transfection) immunostaining. Values represent percentage of EGFP+ cells. Results are expressed as mean ± SEM of three to four independent experiments with total numbers of cells counted ranging between 350 and 420 for each antibody. *p < 0.001 (compared with mock-transfected cells), Student's t test.
Figure 10.
Figure 10.
Sox17 regulates MBP gene transcription. Purified OPCs were cultured in PDGF (10 ng/ml) for 1–2 d before transient transfection. A, OPCs were transiently transfected with pCMV–Sox17–IRES2–AcGFP or pCMV–IRES2–AcGFP as in Figure 9 and analyzed by RT-qPCR 48 h after transfection (24 h in PDGF, followed by 24 h in DME–N1). After normalization with actin, MBP, CNP, and MAG RNA levels are expressed as fold over vector-transfected samples. *p < 0.05, **p < 0.01 versus vector controls, Student's t test. B, COS7 cells were transiently transfected with 0.4 μg of SoxBSLuc, SV40Luc, or MBPLuc, together with 0.8 μg of pCMV–Sox17–IRES2–AcGFP or pCMV5–Sox10 expression plasmids. SoxBSLuc contains four copies of the Sox consensus binding site AACAAT cloned upstream of the SV40 promoter of SV40Luc. Controls were cotransfected with 0.8 μg of empty vector CMV–TnT or pCMV–IRES2–AcGFP. Luciferase activities measured at 48 h after transfection in PDGF were normalized with total protein concentration and/or cotransfected SV40β-galactosidase plasmid. Fold change in luciferase activity is expressed as a ratio of normalized luciferase activity with Sox17 or Sox10 to normalized vector-cotransfected controls. All data represent means ± SEM of three to five independent experiments. *p < 0.005 versus vector control, Student's t test. C, Primary OPCs and CG4 cells were transiently transfected with MBPLuc in the presence of PDGF. Luciferase activity was measured at 48 h after transfection in PDGF. Data are expressed as in B. *p < 0.005, **p < 0.001 versus vector control, Student's t test.

Similar articles

Cited by

References

    1. Aguirre A, Gallo V. Postnatal neurogenesis and gliogenesis in the olfactory bulb from NG2-expressing progenitors of the subventricular zone. J Neurosci. 2004;24:10530–10541. - PMC - PubMed
    1. Barres BA, Lazar MA, Raff MC. A novel role for thyroid hormone, glucocorticoids and retinoic acid in timing oligodendrocyte development. Development. 1994;120:1097–1108. - PubMed
    1. Baumann N, Pham-Dinh D. Biology of oligodendrocyte and myelin in the mammalian central nervous system. Physiol Rev. 2001;81:871–927. - PubMed
    1. Belachew S, Aguirre AA, Wang H, Vautier F, Yuan X, Anderson S, Kirby M, Gallo V. Cyclin-dependent kinase-2 controls oligodendrocyte progenitor cell cycle progression and is downregulated in adult oligodendrocyte progenitors. J Neurosci. 2002;22:8553–8562. - PMC - PubMed
    1. Belachew S, Chittajallu R, Aguirre AA, Yuan X, Kirby M, Anderson S, Gallo V. Postnatal NG2 proteoglycan-expressing progenitor cells are intrinsically multipotent and generate functional neurons. J Cell Biol. 2003;161:169–186. - PMC - PubMed

Publication types

MeSH terms

LinkOut - more resources