. 2006 Sep 15;20(18):2513-26.
doi: 10.1101/gad.1446006.

A cell-type-specific transcriptional network required for estrogen regulation of cyclin D1 and cell cycle progression in breast cancer

Affiliations

A cell-type-specific transcriptional network required for estrogen regulation of cyclin D1 and cell cycle progression in breast cancer

Jérôme Eeckhoute et al. Genes Dev. .

Abstract

Estrogen stimulates the proliferation of the most common type of human breast cancer that expresses estrogen receptor alpha (ERalpha) through the activation of the cyclin D1 (CCND1) oncogene. However, our knowledge of ERalpha transcriptional mechanisms remains limited. Hence, it is still elusive why ERalpha ectopically expressed in ER-negative breast cancer cells (BCC) is functional on ectopic reporter constructs but lacks activity on many endogenous target genes, including CCND1. Here, we show that estradiol (E2) stimulation of CCND1 expression in BCC depends on a novel cell-type-specific enhancer downstream from the CCND1 coding region, which is the primary ERalpha recruitment site in estrogen-responsive cells. The pioneer factor FoxA1 is specifically required for the active chromatin state of this enhancer and as such is crucial for both CCND1 expression and subsequent cell cycle progression. Interestingly, even in BCC, CCND1 levels and proliferation are tightly controlled by E2 through the establishment of a negative feedforward loop involving the induction of NFIC, a putative tumor suppressor capable of directly repressing CCND1 transcription. Taken together, our results reveal an estrogen-regulated combinatorial network including cell-specific cis- and trans-regulators of CCND1 expression where ERalpha collaborates with other transcription factors associated with the ER-positive breast cancer phenotype, including FoxA1 and NFIC.


Figures
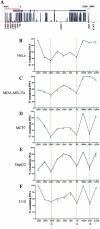
Figure 1.
Figure 1.
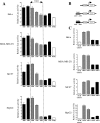
Profiling of the DNase I sensitivity of the evolutionarily conserved regions in the vicinity of the CCND1 gene. (A) Schematic representation of the conserved regions at the CCND1 locus from the University of California at Santa Cruz genome browser. The CCND1 gene is shown at the top with blocks representing the exons. The track at the bottom of the gene shows a measure of evolutionary conservation between 17 vertebrate species based on a phylogenetic hidden Markov model. The conserved regions studied in this work upstream (−3000 to 0 bp; red frame) and downstream (d280–d880 bp; green frame) from the CCND1 gene are highlighted. The location of real-time PCR amplicons generated by PCR primer sets used throughout this work is indicated at the bottom part of the panel. (B–F) DNase I sensitivity assays were performed as indicated in Materials and Methods with intact nuclei from the indicated cells. The percent (%) of remaining DNA after partial digestion is indicated for every analyzed sequence throughout the CCND1 locus. Results are means ± SE from two independent experiments. The HS sites are indicated by the arrows at the bottom of the graphs and by the vertical dotted lines.
Figure 2.
Figure 2.
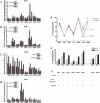
The HS sites at −2000 and d500 bp correspond to transcriptional enhancers. (A) Reporter assays were performed in the indicated cell lines with various constructs spanning the upstream sequence of CCND1.(B) Schematic of the constructs used in C. The gray rectangles represent enh1 and the black rectangles represent enh2. (C) Reporter assays were performed in the indicated cell lines with constructs depicted in B. Each enhancer was cloned and analyzed in both orientations, which are noted sense (s) and reverse (r). Transcriptional activities are expressed relative to that of the respective control luciferase vector (white bar), which was set to 1. All results are means ± SE from at least three independent experiments performed in triplicate.
Figure 3.
Figure 3.
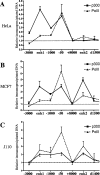
Recruitment of p300 and PolII to the CCND1 gene regulatory regions. ChIP assays were used to analyze p300 (solid line) and PolII (dotted line) recruitment to the CCND1 regulatory regions in HeLa (A), MCF7 (B), and J110 (C) cells. Amounts of immunoprecipitated DNA were normalized to inputs and reported relative to the amount obtained at +8000 bp, which was set to one (indicated by the horizontal black dotted line). The +8000-bp site was used to normalize all the ChIP data in this study because it represented a negative control for transcription factor and coactivator binding (only low amounts of PolII were present at this site). Results are means ± SE from two to four independent experiments.
Figure 4.
Figure 4.
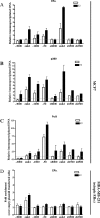
Primary recruitment of ERα to the E2-responsive enh2 in MCF7 cells. ChIP assays were performed to analyze ERα (A), p300 (B), and PolII (C) recruitment to the CCND1 regulatory regions upon E2 stimulation of MCF7 cells. Amounts of immunoprecipitated DNA were normalized to inputs and reported relative to the amount obtained at +8000 bp in the absence of ligand, which was set to 1 (indicated by the horizontal black dotted line). (D) ChIP of ERα ectopically expressed in MDA-MB-231 was used to verify the cell-type-specific activity of enh2. Data were expressed as fold chromatin enrichment over empty control plasmid-transfected cells. All results are means ± SE from two to four independent experiments.
Figure 5.
Figure 5.
Pattern of transcription factor recruitment to the CCND1 gene regulatory regions in BCC. Recruitment of the indicated transcription factors was analyzed by ChIP in MCF7 cells. Data were analyzed as in Figure 4. Results are means ± SE from two to five independent experiments.
Figure 6.
Figure 6.
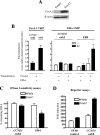
Analysis of CCND1 expression and cell cycle progression after silencing of transcription factors recruited to the CCND1 regulatory regions. (A) Western blot (Wblot) assays were performed on whole-cell extracts of cells transfected with si LUC, si FoxA1, or si NFIC to analyze expression of the specific transcription factors silenced (left) and of β-actin (right). CCND1 (B) and ERα (C) mRNA expression levels were determined by real-time RT–PCR in MCF7 cells transfected with the indicated siRNA and challenged with E2 or vehicle alone for 3 h. CCND1 and ERα mRNA expression levels were expressed relative to expression in si LUC-transfected cells treated with vehicle, which was set to 1. Results are means ± SE from at least three independent experiments. (*) p < 0.05, (***) p < 0.001 versus si LUC-transfected cells similarly treated. (D) CCND1 expression was analyzed by Western blot using whole-cell extracts from MCF7 cells transfected with the indicated siRNA and challenged with E2 or vehicle alone for 6 h. CCND1 expression was quantified by densitometry and normalized using calnexin as a loading control. CCND1 expression levels were expressed relative to expression in si LUC-transfected cells treated with vehicle, which was set to 1. Images of the Western blots are presented in Supplementary Figure 6. (E) MCF7 cells transfected with the indicated siRNAs were challenged with E2 or vehicle alone for 20–24 h. DNA contents were analyzed by propidium iodide staining and flow cytometry. Results are expressed as percent change in the fraction of cells in the S, G2, and M phases of the cell cycle relative to control (si LUC-transfected cells treated with vehicle) and are means ± SE from three separate assays. (*) p < 0.05 versus si LUC-transfected cells similarly treated. For si NFIC-transfected cells challenged with E2, p = 0.069. (F) Cell viability assays were performed as described in Materials and Methods using MCF7 cells transfected with the indicated siRNAs. Relative cell numbers were determined after 3 d of E2 stimulation and are expressed as percent change relative to control (si LUC-transfected cells treated with vehicle). Results are means ± SE from one representative experiment performed in sextuplicate. p < 0.01 (**) and p < 0.001 (***) versus si LUC-transfected cells similarly treated.
Figure 7.
Figure 7.
FoxA1 regulates CCND1 expression by defining the functionality of enh2 in BCC. MCF7 cells transfected with si LUC or si FoxA1 were used in ChIP experiments analyzing recruitment of ERα (A), p300 (B), and PolII (D) as well as H4 acetylation (AcH4) (C) to the CCND1 regulatory regions. Amounts of immunoprecipitated DNA were normalized to inputs and reported relative to the amount obtained at +8000 bp with si LUC-transfected cells treated with vehicle alone, which was set to 1. Results are means ± SE from two or three independent experiments. (E) Intact nuclei from MCF7 cells transfected with si LUC or si FoxA1 were used in DNase I sensitivity assays performed as in Figure 1. The percent of remaining DNA corresponding to the enh2 (d500 bp) after partial digestion is indicated. (F) DNase I sensitivity assays were performed using primers that spanned ERα-binding sites previously identified (Carroll et al. 2005). p < 0.05 (*) and p < 0.01 (**) versus si LUC-transfected cells. For ER4 and ER13, p values were 0.076 and 0.053, respectively. (G) DNase I sensitivity assays were performed in HeLa, MDA-MB-231, and HepG2 cells as indicated. DNase I sensitivity (+) and insensitivity (−) were determined using the DNase I insensitive control rhodopsin locus as a reference. Results of all DNase I sensitivity assays are from at least two independent experiments.
Figure 8.
Figure 8.
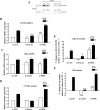
Functional activities of FoxA1 ectopically expressed in MDA-MB-231 cells. (A) Western blot performed with extracts from MDA-MB-231 cells transfected with a FoxA1 expression vector or the empty control plasmid. (B) FoxA1 and ERα recruitment to CCND1 enh2 and ER4 in transfected MDA-MB-231 cells was analyzed by ChIP experiments. Results are means ± SE from two independent experiments and are expressed as fold chromatin enrichment over empty control plasmid transfected cells. (C) DNase I sensitivity assays were performed using nuclei from transfected MDA-MB-231 cells. Results are means ± SE from two independent experiments. (*) p < 0.05 versus cells transfected with the empty control vector. (D) MDAMB-231 cells were transfected with 25 ng of the pGL3-SV40 promoter construct (control) or pGL3-SV40 enh2 together with 1 ng of empty pcDNA3 (white bars) or pcDNA3-FoxA1 (black bars). Transcriptional activities were expressed relative to the activity obtained with control plasmids only, which was set to 100. Results are means ± SE from three independent experiments performed in triplicate.
Figure 9.
Figure 9.
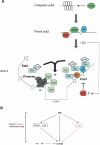
Model of the combinatorial transcription factor network regulating CCND1 expression in ERα-positive BCC. (A) The recruitment pattern of the key transcription factors involved in E2 regulation of CCND1 expression is shown. Competent enh2 is recognized by FoxA1 that triggers chromatin remodeling, allowing recruitment of additional transcription factors including Sp1 that make enh2 sensitive to E2 induction (poised). Upon E2 stimulation, ERα is predominantly loaded at enh2 and mediates E2 transcriptional induction through communication with the upstream regulatory sites. NFIC is a repressor that enables E2 to balance its regulation of CCND1 transcription. The CCND1 transcribed sequence is represented as a dotted line, andnucleosomes are represented as ellipses. (B) Transcription factor network involved in estrogen modulation of CCND1 expression in human BCC. Arrows indicate transcriptional activations. NFIC that serves as a transcriptional repressor is displayed in red.

Similar articles

Cited by

References

    1. Altucci, L., Addeo, R., Cicatiello, L., Dauvois, S., Parker, M.G., Truss, M., Beato, M., Sica, V., Bresciani, F., Weisz, A. 17β-Estradiol induces cyclin D1 gene transcription, p36D1–p34cdk4 complex activation and p105Rb phosphorylation during mitogenic stimulation of G(1)-arrested human breast cancer cells. Oncogene. 1996;12:2315–2324. - PubMed
    1. Arnold, A., Papanikolaou, A. Cyclin D1 in breast cancer pathogenesis. J. Clin. Oncol. 2005;23:4215–4224. - PubMed
    1. Arnosti, D.N., Kulkarni, M.M. Transcriptional enhancers: Intelligent enhanceosomes or flexible billboards? J. Cell. Biochem. 2005;94:890–898. - PubMed
    1. Carroll, J.S., Liu, X.S., Brodsky, A.S., Li, W., Meyer, C.A., Szary, A.J., Eeckhoute, J., Shao, W., Hestermann, E.V., Geistlinger, T.R., et al. Chromosome-wide mapping of estrogen receptor binding reveals long-range regulation requiring the forkhead protein FoxA1. Cell. 2005;122:33–43. - PubMed
    1. Castro-Rivera, E., Samudio, I., Safe, S. Estrogen regulation of cyclin D1 gene expression in ZR-75 breast cancer cells involves multiple enhancer elements. J. Biol. Chem. 2001;276:30853–30861. - PubMed

Publication types

MeSH terms