. 2006;34(17):4801-15.
doi: 10.1093/nar/gkl646. Epub 2006 Sep 13.

Effects of Dicer and Argonaute down-regulation on mRNA levels in human HEK293 cells

Affiliations

Effects of Dicer and Argonaute down-regulation on mRNA levels in human HEK293 cells

Daniela Schmitter et al. Nucleic Acids Res. 2006.

Abstract

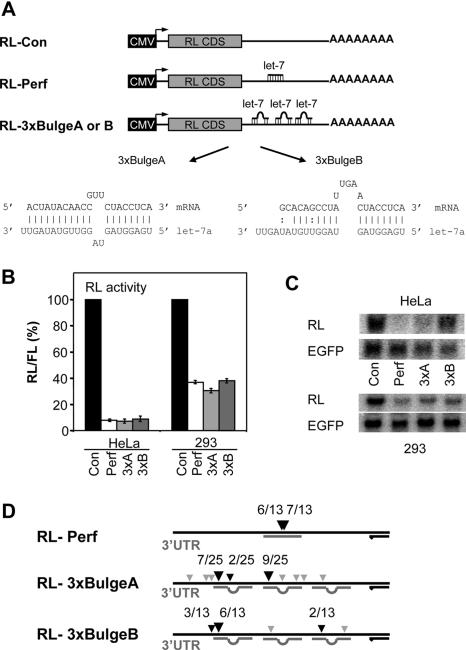
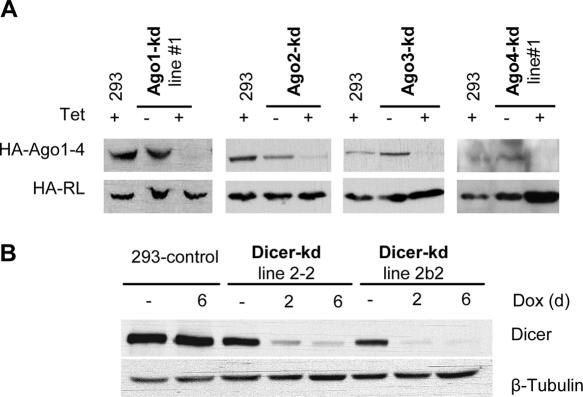
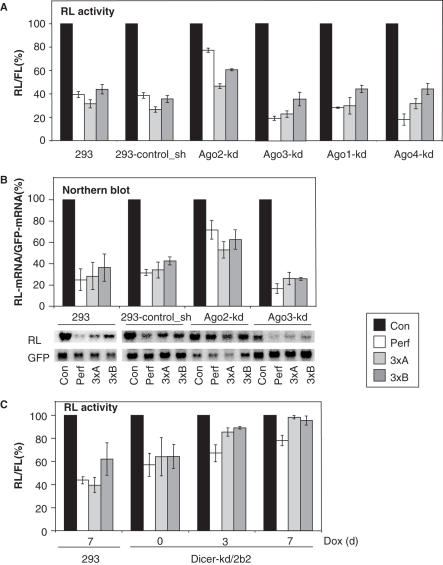
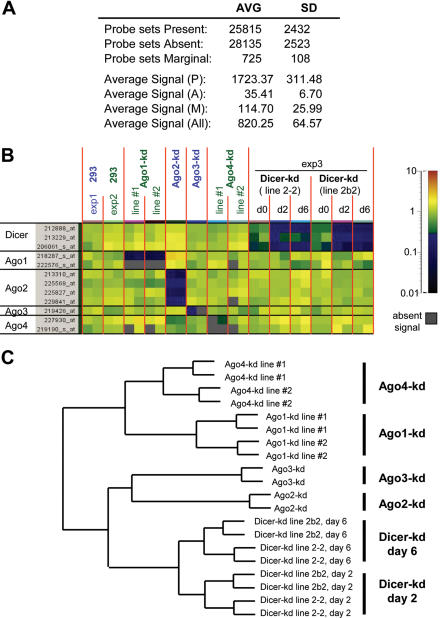
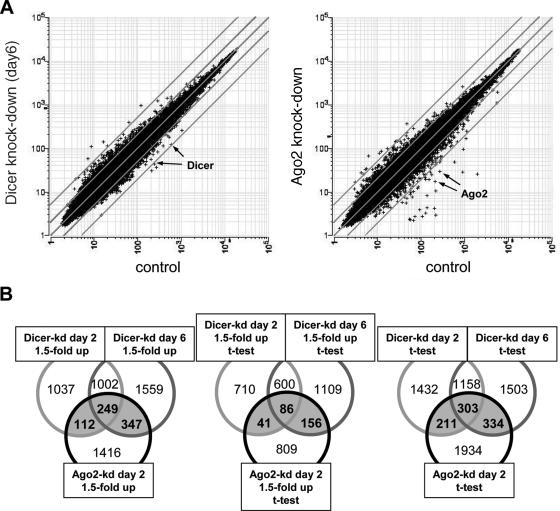
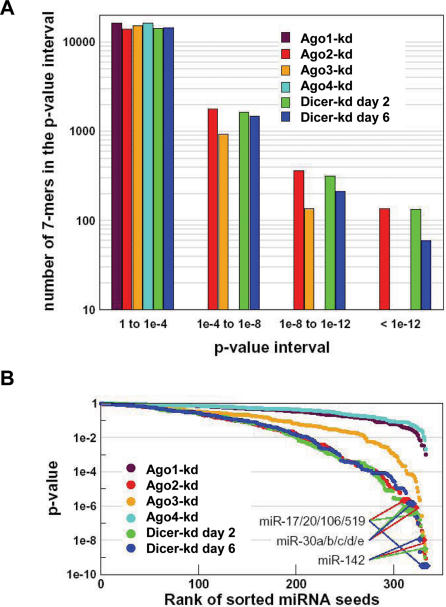
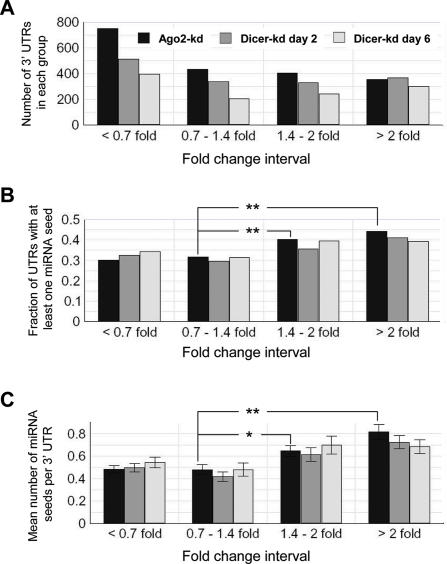
RNA interference and the microRNA (miRNA) pathway can induce sequence-specific mRNA degradation and/or translational repression. The human genome encodes hundreds of miRNAs that can post-transcriptionally repress thousands of genes. Using reporter constructs, we observed that degradation of mRNAs bearing sites imperfectly complementary to the endogenous let-7 miRNA is considerably stronger in human HEK293 than HeLa cells. The degradation did not result from the Ago2-mediated endonucleolytic cleavage but it was Dicer- and Ago2-dependent. We used this feature of HEK293 to address the size of a pool of transcripts regulated by RNA silencing in a single cell type. We generated HEK293 cell lines depleted of Dicer or individual Ago proteins. The cell lines were used for microarray analyses to obtain a comprehensive picture of RNA silencing. The 3'-untranslated region sequences of a few hundred transcripts that were commonly up-regulated upon Ago2 and Dicer knock-downs showed a significant enrichment of putative miRNA-binding sites. The up-regulation upon Ago2 and Dicer knock-downs was moderate and we found no evidence, at the mRNA level, for activation of silenced genes. Taken together, our data suggest that, independent of the effect on translation, miRNAs affect levels of a few hundred mRNAs in HEK293 cells.


Figures

Figure 1
Figure 1
Endogenous let-7 miRNA represses translation of RL reporters transcripts and leads to their partial degradation in different human cell lines. (A) Schematic representation of RL reporter constructs. The 3′-UTR of the RL reporter contains either one perfect or three bulged binding sites for let-7a miRNA. Binding sites are indicated as straight or bulged lines. Differences in target sequence complementarity between the RL-3xBulgeA and B reporters are indicated. Not drawn to scale. CMV, cytomegalovirus promoter; RL CDS, RL coding region. (B) Activity of different RL reporters in transfected HeLa and 293 cells. RL activity values are expressed relative to the activity of firefly luciferase (FL) encoded by the co-transfected pFL-Con. RL/FL value in cells transfected with the pRL-Con was set to 100%. Histogram shows normalized mean values (±SEM) of RL/FL activity from a minimum of three experiments performed in duplicates. (C) Northern blot analysis of expression of RL reporters in 293 and HeLa cells. The EGFP mRNA expression from the co-transfected plasmid (pGFP) served as normalization control. For quantification see Figure 3B and Supplementary Figure S1A. (D) 5′RACE analysis of mRNA expressed from RL reporters in 293 cells. Small gray arrowheads indicate single mapped cleavages, whereas larger black arrowheads are diagnostic of cleavages cloned repeatedly. For exact cleavage positions see Supplementary Figure S2. Positions of regions complementary to let-7a miRNA and the reverse PCR primer (black arrow) are indicated. Abbreviations of RL reporters: Con, pRL-Con; Perf, pRL-Perf; 3xA, pRL-3xBulgeA; and 3xB, pRL-3xBulgeB.
Figure 2
Figure 2
Ago and Dicer protein reduction in inducible knock-down cell lines. (A) Western blot analysis of Ago proteins in knock-down cell lines. The cell lines were co-transfected with plasmids expressing corresponding HA-epitope tagged versions of Ago1 through Ago4. Levels of individual HA-Ago proteins were assayed 48 h post-transfection (60 h post-induction with Tet). Co-transfected plamsid encoding HA-RL served as control. Expression of transiently transfected HA-Ago4 was consistently very low and difficult to detect. 293 is the parental 293T-Rex line. (B) Western blot analysis of endogenous Dicer in knock-down cell lines. 293-control, a cell line carrying an empty pTER vector. Experiments shown in (A and B) were reproduced several times; shown are representative results.
Figure 3
Figure 3
Effects of Ago and Dicer protein knock-downs on expression of RL reporters. (A) Activity of RL reporter constructs in cells with knock-downs of individual Ago proteins (for Ago1-kd and Ago4-kd, lines #1 were used). Luciferase assays were performed 2 days after transfection (60 h post-induction with Tet). Histogram shows normalized mean values (±SEM) of RL/FL activity from three different experiments performed in duplicates (except for Ago3-kd done in two duplicate experiments). (B) Northern blot analysis of expression of RL reporters in Ago2-kd and Ago3-kd lines. mRNA was isolated from cells transfected and induced as described in (A). RL reporter mRNA expression was normalized to EGFP mRNA expressed from a co-transfected plasmid. Histogram shows normalized mean values of RL mRNAs relative to RL mRNA level in cells transfected with the control RL reporter (pRL-Con), which was set to 100%. Error bars (SEM) are derived from four northern blot experiments. Northern blot phosphorimager scans below the graph show results of one representative experiment. (C) Effect of Dicer knock-down on activity of RL reporters. Dicer-kd 2b2 cells were induced with Dox and harvested 3 and 7 days post-induction. Transfection with reporter constructs was performed 2 days before collection. Histogram shows normalized mean values (±SEM) of RL/FL activity from three different experiments performed in duplicates. Small repression of RL-Perf (but not of RL-3xBulgeA and RL-3xBulgeB reporters) still observed even at day 7 likely reflects activity of the residual RISC complex, which turns over when executing RNAi but is required in stochiometric amounts when mediating translational repression.
Figure 4
Figure 4
Microarray analysis of transcriptomes of Dicer and Ago knock-down lines. (A) Selected characteristics of original microarray hybridization signal used for analysis (before per chip normalization) calculated from values of all arrays. AVG, average. Present (P), Absent (A) and Marginal (M) calls for Affymetrix probe sets are generated based on statistical analysis of hybridization signal of oligonucleotides from one probe set where Present, P < 0.04; Marginal, 0.06 > P > 0.04; Absent P > 0.06. Hybridization signal units are arbitrary, derived from the ‘per chip’ scaling to the median. (B) Specificity of knock-down of individual studied components of RNA silencing pathways. A tile plot depicts values normalized ‘per gene’ for probe sets for Dicer and Ago transcripts. Partial decrease of Dicer mRNA is detectable in Dicer-kd lines at day 0. Note that Ago4 hybridization data are inconclusive due to a low expression level of Ago4 mRNA. Although probe 227930_at is annotated as Ago4 and shows reduction in one of the Ago4-kd line, it does not match the human Ago4 sequence (NM_017629). The second Ago4 probe (matching NM_017629) yields a low signal, which does not pass the detection T-test. Individual microarray experiments (exp) are distinguished by colored letters: exp1, blue; exp2, green; and exp3, black. (C) Hierarchical clustering analysis based on a pooled list of genes differentially expressed between controls and knock-down samples. Probe lists for the analysis included all probes in the lane ‘changed (t-test, P < 0.05)’ in Table 2.
Figure 5
Figure 5
Transcriptome changes upon Dicer and Ago2 knock-down. (A) Raw data scatter plots of array signals after Dicer (left panel) and Ago2 (right panel) knock-down in 293 cells. Shown are all 54675 probes from Human U133 plus 2.0 GeneChips™. Each probe is represented by a cross depicting the mean raw expression in control and knock-down samples. Array samples: Dicer knock-down, a pool of Dicer-kd lines 2-2 and 2b2 at day 6; Ago2 knock-down, a duplicate of Ago2-kd induced for 2 days; control (Dicer), a pool of lines 2-2 and 2b2 at day 0 and the 293-control line induced for 0, 2 and 6 days; control (Ago2), a pool of 293 and 293-control_sh lines. Diagonal gray lines represent fold change borders (1-, 2- and 5-fold). Arrows indicate position of Dicer and Ago2 microarray probe sets in corresponding knock-downs. Expression units are arbitrary, the mean value of expressed transcripts is scaled to 500. (B) Venn diagrams showing overlaps of differently filtered gene lists. Filtering of up-regulated transcripts with 1.5-fold cut-off (left), t-test P < 0.05 (right) or their combination (middle). Gray area depicts transcripts up-regulated in Ago2 and at least one Dicer-kd line.
Figure 6
Figure 6
Enrichment of specific heptanucleotides in 3′-UTRs of transcripts up-regulated upon Ago2 and Dicer knock-downs. (A) Distribution of enrichments of all heptamers (47 = 16384) in 3′-UTRs of mRNAs up-regulated in different knock-down lines. Enrichment of each heptamer is calculated as a P-value of the Wilcoxon tests that compares the number of occurrences of each heptamer in the sets of 3′-UTRs that are significantly up-regulated (t-test P-value < 0.05) in one of the six sample sets from knock-down lines relative to the control set of mRNAs showing <10% change in any of the knock-down lines. The horizontal axis shows four bins into which all heptamers were sorted according to their P-values. The vertical axis shows, on a logarithmic scale, a count of heptamers for a given P-value range and a sample set. (B) Distribution of enrichments of heptamers corresponding to known miRNA seed regions. P-values were calculated as in (A) but data are displayed as decreasing P-values of miRNA seeds. The vertical axis shows, on a logarithmic scale, P-values of miRNA seeds from the Wilcoxon test of heptamer enrichment in a given sample set. The horizontal axis corresponds to rank sorted (according to the descending P-value for each sample set) miRNA seeds (nt 2–8) from 328 mature miRNAs from Rfam 8.0 (27). Values for selected miRNAs known to be expressed in 293 cells are indicated.
Figure 7
Figure 7
Analysis of the occurrence of motifs matching the seeds of miR-17/20/106, miR-30 and miR-142 in 3′-UTRs of transcripts that are up-regulated in Ago2-kd at day 2 and both Dicer knock-down cell lines at days 2 and 6. (A) Number of 3′-UTRs for transcripts in each of the analyzed expression categories in three studied knock-down datasets. Expression categories of transcripts were chosen as follows: ‘down-regulated’ (<0.7-fold), ‘unchanged’ (0.7- to 1.4-fold), ‘weakly up-regulated’ (1.4- to 2-fold) and ‘strongly up-regulated’ (>2-fold). (B) Fraction of the total number of 3′-UTRs [shown in (A)] containing at least one seed for the miR-17/20/106, miR-30 or miR-142. (C) Average number (±SEM) of the miR-17/20/106, miR-30 and miR-142 seeds per the 3′-UTR sequence in each of the analyzed expression categories in the three studied knock-down datasets. Asterisks indicate statistically significant difference (t-test, **P < 0.01, *P < 0.05) between ‘unchanged’ and ‘weakly up-regulated’ or ‘strongly up-regulated’ transcripts in Ago2-kd. The complete statistical analysis of categories in (B and C) is given in Supplementary Table 2.

Similar articles

Cited by

References

    1. Sontheimer E.J., Carthew R.W. Silence from within: endogenous siRNAs and miRNAs. Cell. 2005;122:9–12. - PubMed
    1. Zamore P.D., Haley B. Ribo-gnome: the big world of small RNAs. Science. 2005;309:1519–1524. - PubMed
    1. Marques J.T., Devosse T., Wang D., Zamanian-Daryoush M., Serbinowski P., Hartmann R., Fujita T., Behlke M.A., Williams B.R. A structural basis for discriminating between self and nonself double-stranded RNAs in mammalian cells. Nat. Biotechnol. 2006;24:559–565. - PubMed
    1. Wang Q., Carmichael G.G. Effects of length and location on the cellular response to double-stranded RNA. Microbiol. Mol. Biol. Rev. 2004;68:432–452. - PMC - PubMed
    1. Mineno J., Okamoto S., Ando T., Sato M., Chono H., Izu H., Takayama M., Asada K., Mirochnitchenko O., Inouye M., et al. The expression profile of microRNAs in mouse embryos. Nucleic Acids Res. 2006;34:1765–1771. - PMC - PubMed

Publication types

MeSH terms