. 2006 Sep 11;174(6):863-75.
doi: 10.1083/jcb.200603013.

Role of fascin in filopodial protrusion

Affiliations

Role of fascin in filopodial protrusion

Danijela Vignjevic et al. J Cell Biol. .

Abstract

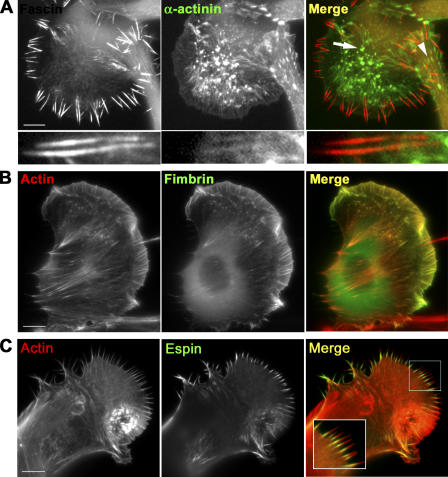
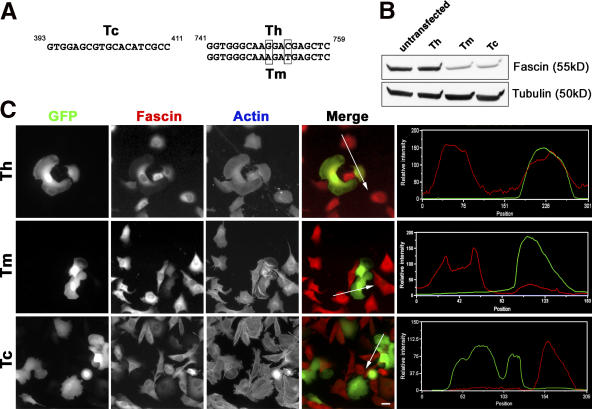
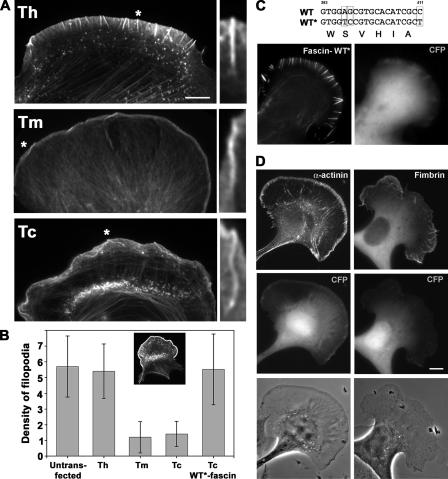
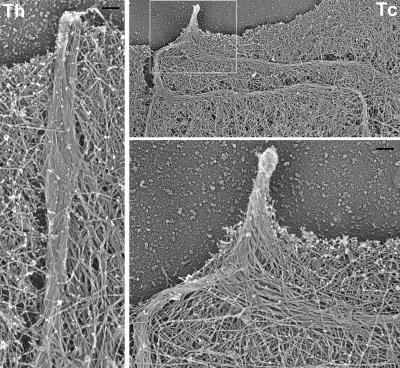
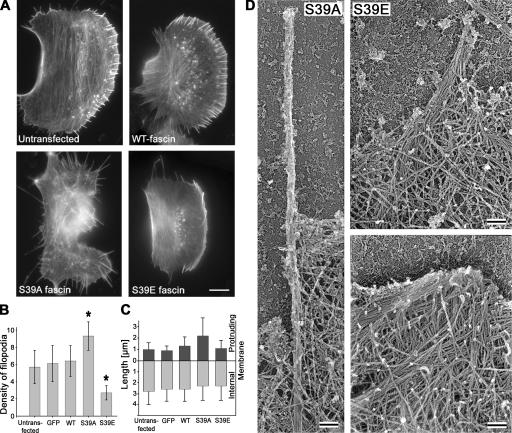
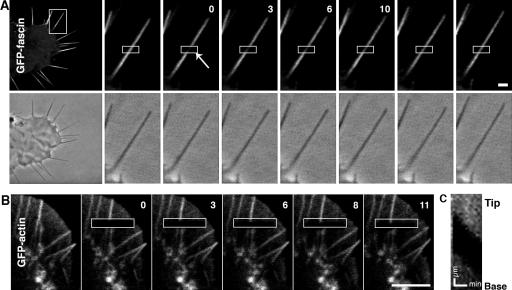
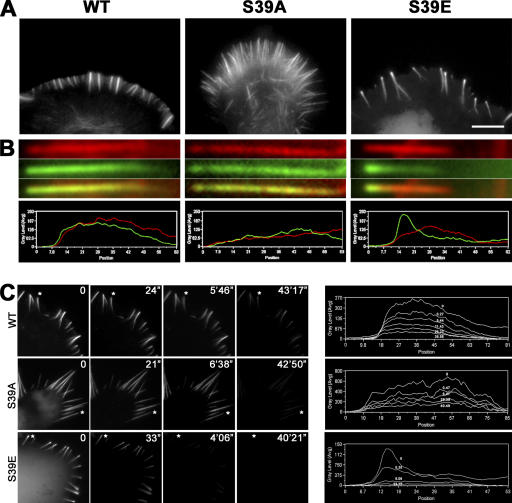
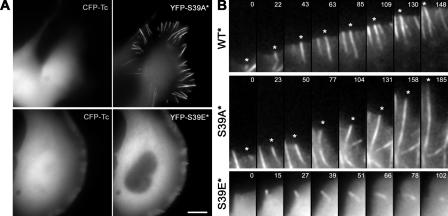
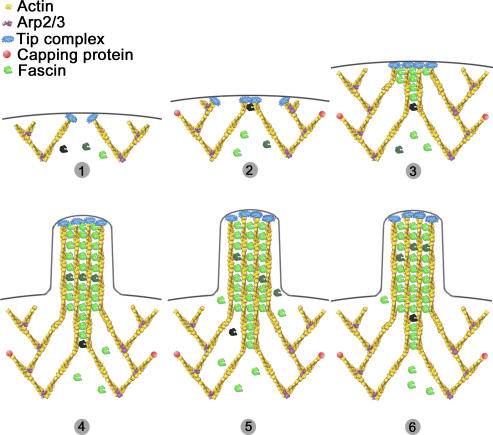
In this study, the mechanisms of actin-bundling in filopodia were examined. Analysis of cellular localization of known actin cross-linking proteins in mouse melanoma B16F1 cells revealed that fascin was specifically localized along the entire length of all filopodia, whereas other actin cross-linkers were not. RNA interference of fascin reduced the number of filopodia, and remaining filopodia had abnormal morphology with wavy and loosely bundled actin organization. Dephosphorylation of serine 39 likely determined cellular filopodia frequency. The constitutively active fascin mutant S39A increased the number and length of filopodia, whereas the inactive fascin mutant S39E reduced filopodia frequency. Fluorescence recovery after photobleaching of GFP-tagged wild-type and S39A fascin showed that dephosphorylated fascin underwent rapid cycles of association to and dissociation from actin filaments in filopodia, with t(1/2) < 10 s. We propose that fascin is a key specific actin cross-linker, providing stiffness for filopodial bundles, and that its dynamic behavior allows for efficient coordination between elongation and bundling of filopodial actin filaments.


Figures

Figure 1.
Figure 1.
Localization of actin cross-linking proteins in B16F1 melanoma cells. (A) YFP-fascin and CFP–α-actinin expression patterns. Fascin is enriched in filopodia, whereas α-actinin localizes to actin “spots” (arrow) and focal contacts (arrowhead), and, slightly, to filopodial roots, but not to protruding parts (bottom row). (B) Localization of GFP-fimbrin. Actin filaments are labeled with the Texas red–X phalloidin. Fimbrin is enriched both in lamellipodia and filopodia. (C) Localization of ectopically expressed GFP-espin. Actin filaments are labeled with the Texas red–X phalloidin. Espin is present only in proximal regions of filopodial bundles. Bars, 10 μm.
Figure 2.
Figure 2.
Expression of shRNA depletes fascin in B16F1 cells. (A) Target sequences for RNAi. Tc (left) is common for mouse and human fascin; Th and Tm (right) are common for human and mouse fascin mRNA, respectively, and differ in two base pairs. (B) Immunoblot analysis. Lysates prepared from FACS-purified cell populations 5 d after transfection were probed with fascin antibody. Tubulin served as a loading control. (C) Microscopic analysis. GFP fluorescence serves as a marker for cells transfected with the Tm, Th, or Tc constructs. Fascin is visualized by immunofluorescence and actin is stained with fluorescent phalloidin. Merged images show GFP (green) and fascin staining (red) simultaneously. Intensity line scans (right) through one transfected and one untransfected cell (lines in merged images) show fascin and GFP intensities in red and green, respectively. Bar, 20 μm.
Figure 3.
Figure 3.
Inhibition of filopodia formation by fascin knockdown. (A) Distribution of actin revealed by phalloidin staining. Fewer filopodia can be seen in cells transfected with knockdown constructs (Tm and Tc) compared with the control (Th). The remaining filopodia are bent and buckled in Tm- and Tc-transfected cells. Asterisk-labeled filopodia are enlarged on the right. (B) Quantification of filopodia. Number of filopodia per 20 μm of cell leading edge was counted in cells untransfected or transfected with the indicated constructs. WT*-fascin stands for YFP-fascin refractory to Tc shRNA. Inset illustrates an example of the cell perimeter area selected for the analysis. Frequency of filopodia is reduced significantly by Tm and Tc shRNA (P < 0.002). (C) Rescue of the knockdown phenotype by fascin. A cell expressing both CFP-Tc shRNA (CFP) and YFP-WT*-fascin refractory to siRNA (fascin-WT*) displays numerous filopodia. (D) Rescue of the knockdown phenotype by α-actinin or T-fimbrin. Filopodia formation in CFP-Tc shRNA–expressing cells (CFP) is not rescued by YFP–α-actinin (left column), and only partially rescued by GFP-fimbrin (right column). Bars, 10 μm.
Figure 4.
Figure 4.
EM of filopodia in fascin knockdown cells. Filopodium in a control Th-shRNA–transfected cell (left) is tightly bundled and runs almost perpendicular to the leading edge. The remaining filopodium in fascin knockdown Tc-shRNA–transfected cell (right) has very long internal bundles, which are bent and buckled behind the leading edge and consist of loosely organized filaments, whereas neighboring lamellipodium has normal dendritic organization. Boxed region is enlarged at bottom right. Bar, 100 nm.
Figure 5.
Figure 5.
Effects of fascin mutants on filopodia number and length. (A) Phalloidin staining of untransfected cells and cells expressing indicated GFP-fascins. S39A- or S39E-expressing cells show increased or decreased filopodia formation, respectively. (B) Number of filopodia per 20 μm of cell leading edge in cells transfected with indicated constructs. Asterisks indicate statistically significant changes (P < 0.003) compared with untransfected cells. GFP stands for empty GFP vector. Error bars represent the mean ± the SEM. (C) Lengths of the filopodia protruding beyond leading edge (dark gray bars) and internal (light gray bars) parts of filopodia. Expression of S39A fascin increases the length of the protruding parts of filopodia. (D) EM of filopodia in cells transfected with fascin mutants. A filopodium in S39A-expressing cell (left) is long, thin, straight, and tightly bundled. In S39E-expressing cell (right), a filopodium is loosely bundled (top). Many long filaments converge at the leading edge, forming an abnormally large Λ-precursor (bottom). Bars: (A) 10 μm; (D) 100 nm.
Figure 6.
Figure 6.
FRAP of GFP-fascin and actin in filopodia. (A) FRAP of GFP-fascin. Fluorescence and phase-contrast images of a GFP-fascin–expressing B16F1 cell show an overview of the cell (left) and a time-lapse sequence of the boxed region before and after photobleaching. Fluorescence of GFP-fascin recovered within 30 s. (B) FRAP of GFP-actin. Fluorescence time-lapse sequence of B16F1 cell expressing GFP-actin. There was no fluorescence recovery of GFP-actin over time. Time after bleaching in A and B is given in seconds. Fluorescence images are presented after correction of photofading during image acquisition (see Materials and methods). (C) Kymograph analysis of the bleached filopodium. The bleached region moved toward the base of the filopodium at the rate of 2 μm/min. Bars, 1 μm.
Figure 7.
Figure 7.
Distribution of fascin mutants in filopodial bundles. (A) Fluorescence images of cells expressing GFP-tagged WT, S39A, and S39E fascins. S39E fascin is enriched at filopodial tips. Bar, 10 μm. (B) Individual filopodia (top) and corresponding fluorescent intensity line scans (bottom) from GFP-fascin–transfected cells costained with phalloidin. Red, actin; green, fascin. Inactive S39E mutant is significantly enriched at filopodial tips, whereas distribution of WT and S39A fascins matches that of actin. (C, left) Fascin dissociation from filopodia after detergent extraction. Cells transfected with indicated GFP-tagged fascins are shown live immediately before extraction (time 0) and after detergent extraction for indicated periods of time. WT and S39A fascin remain associated with filopodia for a long time after cell lysis, whereas S39E fascin dissociates within the first 30 s from the tip of filopodia. (right) Line-scan analysis of kinetics of fascin dissociation. Fluorescence intensity profile of GFP-fascin is shown along the length of the filopodia indicated by asterisks in A (filopodial tips are at left). Individual lines in each plot represent different time points after lysis, as indicated.
Figure 8.
Figure 8.
Dynamics of WT and mutant fascins in living cells. (A) Fluorescence images of cells expressing both CFP-Tc-shRNA (left) and one of YFP-tagged fascins refractory to shRNA (right). Active S39A fascin mutant (S39A*) induces numerous filopodia and shows localization along their length, whereas inactive S39E fascin mutant (S39E*) fails to increase the frequency of filopodia even at high levels of expression and shows mostly diffuse localization throughout the cytoplasm with slight enrichment in occasional filopodia. Bar, 10 μm. (B) Filopodial dynamics of WT or mutant fascins. Asterisks mark specific filopodia over time. Time is shown in seconds.
Figure 9.
Figure 9.
Model of fascin role in filopodia formation. (1) Uncapped actin filaments elongate and form Λ-precursors. (2) Fascin becomes recruited to the tip complex, through low-affinity interaction. (3) Elongation of filaments is closely followed by fascin recruitment and cross-linking, which allows the bundling process to keep up with elongation and guarantees efficient pushing. (4) Filopodia is formed. (5 and 6) Fascin molecules undergo fast dissociation/association from the shaft of filopodia, ensuring its concentration is high enough, which is necessary for coordination of actin elongation and bundling at the filopodia tips. Different shades of fascin are used to illustrate the dynamic character of the bundling process.

Similar articles

Cited by

References

    1. Adams, J.C., J.D. Clelland, G.D. Collett, F. Matsumura, S. Yamashiro, and L. Zhang. 1999. Cell-matrix adhesions differentially regulate fascin phosphorylation. Mol. Biol. Cell. 10:4177–4190. - PMC - PubMed
    1. Al-Alwan, M.M., G. Rowden, T.D. Lee, and K.A. West. 2001. Fascin is involved in the antigen presentation activity of mature dendritic cells. J. Immunol. 166:338–345. - PubMed
    1. Anilkumar, N., M. Parsons, R. Monk, T. Ng, and J.C. Adams. 2003. Interaction of fascin and protein kinase Calpha: a novel intersection in cell adhesion and motility. EMBO J. 22:5390–5402. - PMC - PubMed
    1. Bartles, J.R. 2000. Parallel actin bundles and their multiple actin-bundling proteins. Curr. Opin. Cell Biol. 12:72–78. - PMC - PubMed
    1. Bartles, J.R., L. Zheng, A. Li, A. Wierda, and B. Chen. 1998. Small espin: a third actin-bundling protein and potential forked protein orthologue in brush border microvilli. J. Cell Biol. 143:107–119. - PMC - PubMed

Publication types

Associated data