Cooperative astrocyte and dendritic spine dynamics at hippocampal excitatory synapses
- PMID: 16943543
- PMCID: PMC6675342
- DOI: 10.1523/JNEUROSCI.1302-06.2006
Cooperative astrocyte and dendritic spine dynamics at hippocampal excitatory synapses
Abstract
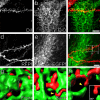
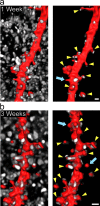
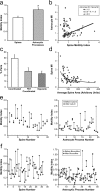
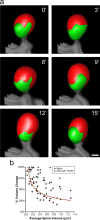
Accumulating evidence is redefining the importance of neuron-glial interactions at synapses in the CNS. Astrocytes form "tripartite" complexes with presynaptic and postsynaptic structures and regulate synaptic transmission and plasticity. Despite our understanding of the importance of neuron-glial relationships in physiological contexts, little is known about the structural interplay between astrocytes and synapses. In the past, this has been difficult to explore because studies have been hampered by the lack of a system that preserves complex neuron-glial relationships observed in the brain. Here we present a system that can be used to characterize the intricate relationship between astrocytic processes and synaptic structures in situ using organotypic hippocampal slices, a preparation that retains the three-dimensional architecture of astrocyte-synapse interactions. Using time-lapse confocal imaging, we demonstrate that astrocytes can rapidly extend and retract fine processes to engage and disengage from motile postsynaptic dendritic spines. Surprisingly, astrocytic motility is, on average, higher than its dendritic spine counterparts and likely relies on actin-based cytoskeletal reorganization. Changes in astrocytic processes are typically coordinated with changes in spines, and astrocyte-spine interactions are stabilized at larger spines. Our results suggest that dynamic structural changes in astrocytes help control the degree of neuron-glial communication at hippocampal synapses.
Figures


Similar articles
-
Glial glutamate transport modulates dendritic spine head protrusions in the hippocampus.Glia. 2012 Jul;60(7):1067-77. doi: 10.1002/glia.22335. Epub 2012 Apr 4. Glia. 2012. PMID: 22488940
-
Structural and functional plasticity of astrocyte processes and dendritic spine interactions.J Neurosci. 2014 Sep 17;34(38):12738-44. doi: 10.1523/JNEUROSCI.2401-14.2014. J Neurosci. 2014. PMID: 25232111 Free PMC article.
-
Synaptic potentiation induces increased glial coverage of excitatory synapses in CA1 hippocampus.Hippocampus. 2009 Aug;19(8):753-62. doi: 10.1002/hipo.20551. Hippocampus. 2009. PMID: 19156853
-
[Visualization of synapse-glia dynamics].Brain Nerve. 2007 Jul;59(7):755-61. Brain Nerve. 2007. PMID: 17663147 Review. Japanese.
-
Glial Cell Modulation of Dendritic Spine Structure and Synaptic Function.Adv Neurobiol. 2023;34:255-310. doi: 10.1007/978-3-031-36159-3_6. Adv Neurobiol. 2023. PMID: 37962798 Review.
Cited by
-
Astrocytes Control Synapse Formation, Function, and Elimination.Cold Spring Harb Perspect Biol. 2015 Feb 6;7(9):a020370. doi: 10.1101/cshperspect.a020370. Cold Spring Harb Perspect Biol. 2015. PMID: 25663667 Free PMC article. Review.
-
The transmembrane transporter domain of glutamate transporters is a process tip localizer.Sci Rep. 2015 Mar 12;5:9032. doi: 10.1038/srep09032. Sci Rep. 2015. PMID: 25761899 Free PMC article.
-
β-Adrenergic Signaling Promotes Morphological Maturation of Astrocytes in Female Mice.J Neurosci. 2023 Dec 13;43(50):8621-8636. doi: 10.1523/JNEUROSCI.0357-23.2023. J Neurosci. 2023. PMID: 37845031 Free PMC article.
-
Astrocytes display complex and localized calcium responses to single-neuron stimulation in the hippocampus.J Neurosci. 2011 Jun 15;31(24):8905-19. doi: 10.1523/JNEUROSCI.6341-10.2011. J Neurosci. 2011. PMID: 21677174 Free PMC article.
-
Local ATP generation by brain-type creatine kinase (CK-B) facilitates cell motility.PLoS One. 2009;4(3):e5030. doi: 10.1371/journal.pone.0005030. Epub 2009 Mar 31. PLoS One. 2009. PMID: 19333390 Free PMC article.
References
-
- Benediktsson AM, Schachtele SJ, Green SH, Dailey ME. Ballistic labeling and dynamic imaging of astrocytes in organotypic hippocampal slice cultures. J Neurosci Methods. 2005;141:41–53. - PubMed
-
- Berman RF, Hannigan JH, Sperry MA, Zajac CS. Prenatal alcohol exposure and the effects of environmental enrichment on hippocampal dendritic spine density. Alcohol. 1996;13:209–216. - PubMed
-
- Bezzi P, Carmignoto G, Pasti L, Vesce S, Rossi D, Rizzini BL, Pozzan T, Volterra A. Prostaglandins stimulate calcium-dependent glutamate release in astrocytes. Nature. 1998;391:281–285. - PubMed
-
- Bezzi P, Gundersen V, Galbete JL, Seifert G, Steinhauser C, Pilati E, Volterra A. Astrocytes contain a vesicular compartment that is competent for regulated exocytosis of glutamate. Nat Neurosci. 2004;7:613–620. - PubMed
-
- Bishop DL, Misgeld T, Walsh MK, Gan WB, Lichtman JW. Axon branch removal at developing synapses by axosome shedding. Neuron. 2004;44:651–661. - PubMed
Publication types
MeSH terms
LinkOut - more resources
Full Text Sources
Other Literature Sources
Miscellaneous
