. 2006 Sep;26(18):6808-18.
doi: 10.1128/MCB.00245-06.

Development of macrophages with altered actin organization in the absence of MafB

Affiliations

Development of macrophages with altered actin organization in the absence of MafB

Athar Aziz et al. Mol Cell Biol. 2006 Sep.

Abstract

In the hematopoietic system the bZip transcription factor MafB is selectively expressed at high levels in monocytes and macrophages and promotes macrophage differentiation in myeloid progenitors, whereas a dominant-negative allele can inhibit this process. To analyze the requirement of MafB for macrophage development, we generated MafB-deficient mice and, due to their neonatal lethal phenotype, analyzed macrophage differentiation in vitro, in the embryo, and in reconstituted mice. Surprisingly we observed in vitro differentiation of macrophages from E14.5 fetal liver (FL) cells and E18.5 splenocytes. Furthermore we found normal numbers of F4/80(+)/Mac-1(+) macrophages and monocytes in fetal liver, spleen, and blood as well as in bone marrow, spleen, and peritoneum of adult MafB(-/-) FL reconstituted mice. MafB(-/-) macrophages showed intact basic macrophage functions such as phagocytosis of latex beads or Listeria monocytogenes and nitric oxide production in response to lipopolysaccharide. By contrast, MafB(-/-) macrophages expressed increased levels of multiple genes involved in actin organization. Consistent with this, phalloidin staining revealed an altered morphology involving increased numbers of branched protrusions of MafB(-/-) macrophages in response to macrophage colony-stimulating factor. Together these data point to an unexpected redundancy of MafB function in macrophage differentiation and a previously unknown role in actin-dependent macrophage morphology.


Figures

FIG. 1.
FIG. 1.
Analysis of myeloid cells from control and MafB−/− E14.5 fetal liver. A and B. Cell suspensions of control MafB+/− (A) and MafB−/− (B) E14.5 fetal liver were cytocentrifuged and stained with Diff-Quick histological stain. C and D. Cells from control MafB+/− (C) and MafB−/− (D) E14.5 fetal livers were cultured in M-CSF-, GM-CSF-, and IL-3-containing semisolid medium for 11 days, washed out from methylcellulose, and stained with Diff-Quick histological stain. Black and red arrows indicate granulocytes and macrophages, respectively.
FIG. 2.
FIG. 2.
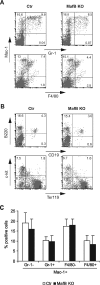
Flow cytometric analysis of hematopoietic cells from control and MafB−/− E14.5 fetal liver. A and B. FACS profiles of MafB+/+ control and MafB−/− E14.5 fetal liver cells identifying myelomonocytic and granulocytic (Mac-1/Gr-1 and Mac-1/F4/80) populations (A) or B-lymphoid (B-220/CD19) and erythroid (Terr-119/c-kit) populations (B). C. Quantification of different populations of Mac-1-positive myeloid cells from MafB+/+ control (n = 7) and MafB−/− (n = 7) E14.5 fetal liver cells, shown as percentages of Terr-119-negative cells. Statistical analysis by two-tailed Mann-Whitney test revealed no statistical significance of the observed minor differences (P values from left to right: 0.16, 0.33, 0.37, and 0.20). Error bars indicate standard errors of the means.
FIG. 3.
FIG. 3.
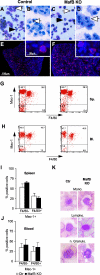
Analysis of myeloid cells from control and MafB−/− E18.5 fetal spleen and newborn blood. A and C. Cell suspensions of control MafB+/− (A) and MafB−/− (C) E18.5 fetal spleen were cytocentri fuged and stained with Diff-Quick histological stain. Black and white arrows indicate granulocytes and monocytes, respectively. B and D. Dried and Diff-Quick-stained colonies from day 6 plasma clot assays of control MafB+/− (B) and MafB−/− (D) E18.5 fetal spleen in the presence of GM-CSF, showing a macrophage colony. White arrows indicate examples of individual macrophages. E and F. Immunofluorescence staining for spleen macrophages with anti-F4/80 antibody on frozen sections of control MafB+/+ (E) and MafB−/− (F) E18.5 fetal spleen. G. Flow cytometric analysis of myelomonocytic cell populations from MafB+/+ control (left) and MafB−/− (right) E18.5 fetal spleen. H. Flow cytometric analysis of myelomonocytic cell populations in MafB+/+ (left) control and MafB−/− (right) newborn blood. I. Quantification of different Mac-1-positive myelomonocytic cell populations from MafB+/+ control (n = 11) and MafB−/− (n = 5) E18.5 fetal spleen cells, shown as percentage of total cells. Statistical analysis by two-tailed Mann-Whitney test revealed low or no statistical significance of the observed minor differences (P values from left to right: 0.02 and 0.08). J. Quantification of Mac-1-positive myeloid cell populations from MafB+/+ control (n = 9) and MafB−/− (n = 5) newborn blood after lysis of erythrocytes. Statistical analysis by two-tailed Mann-Whitney test revealed no statistical significance of the observed small differences (P values from left to right: 0.13 and 0.08). Error bars in panels I and J indicate standard errors of the means. K. Histological staining of monocytes, lymphocytes, and granulocytes from blood smears of MafB+/+ control and MafB−/− newborn blood.
FIG. 4.
FIG. 4.
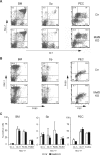
Flow cytometric analysis of myeloid cells from adult lethally irradiated mice reconstituted with MafB+/+ control and MafB−/− E14.5 fetal liver cells. A and B. FACS profiles of Mac-1/Gr-1 myeloid (A) and Mac-1/F4/80 myelomonocytic (B) populations from bone marrow (BM), spleen (Sp), and peritoneal exudate cells (PEC), 4 days after thioglycolate stimulation, from irradiated mice reconstituted with a MafB+/+ control or MafB−/− hematopoietic system. C. Quantification of Mac-1-positive myeloid cell populations from MafB+/+ control (n = 4) and MafB−/− (n = 4) bone marrow, spleen, and peritoneal exudate cells. Statistical analysis by two-tailed Mann-Whitney test revealed low or no statistical significance of the observed minor differences (P values from left to right: bone marrow, 0.014, 0.24, 0.17, and 0.17; spleen, 0.17, 0.56, 0.56, and 0.44; peritoneal exudate cells, 0.1, 0.2, and 0.5). Error bars indicate standard errors of the means.
FIG. 5.
FIG. 5.
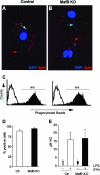
Functional analysis of macrophages differentiated in vitro from control and MafB−/− E14.5 fetal liver cells. A and B. Confocal images of MafB+/− control (A) or MafB−/− (B) macrophages infected with Listeria monocytogenes showing DAPI-stained bacterial and cellular DNA (in blue) and phalloidin-stained actin (in red). Both killed bacteria without actin tail (blue arrows indicate examples) and infectious actin-tailed bacteria that have escaped the phagolysosome (red arrows indicate examples) are visible in both genotypes. C. FACS analysis of MafB+/+ control (left) and MafB−/− (right) macrophage cultures incubated for 2 h with fluorescent latex beads to quantify phagocytic capacity. D. Quantification of percent phagocytic cells from panel C (n = 2). E. NO production measured as μM nitrite accumulated in the medium of MafB+/+ control and MafB−/− macrophage cultures (n = 3) with 1 × 10⁶ cells, 24 h after stimulation with 100 ng/ml LPS and 50 U/ml IFN-γ. Error bars indicate standard errors of the means.
FIG. 6.
FIG. 6.
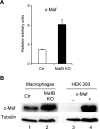
Expression of c-Maf in control and MafB−/− macrophages. A. Quantitative real-time RT-PCR for c-Maf on mRNA isolated from pooled MafB+/+ control (n = 3) and MafB−/− (n = 2) in vitro-differentiated macrophage cultures shown as arbitrary units of expression levels. Samples were normalized to HPRT expression, and expression data were confirmed in two independent experiments. Error bars indicate standard errors of the means. B. Western blot analysis for c-Maf expression in pooled MafB+/+ control (n = 3, lane 1) and MafB−/− (n = 2, lane 2) in vitro-differentiated macrophages. Lanes 3 and 4 show extracts from untransfected or c-Maf expression plasmid-transfected HEK 293 cells, respectively.
FIG. 7.
FIG. 7.
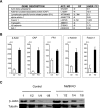
Differential gene expression in macrophages differentiated in vitro from control and MafB−/− E14.5 fetal liver cells. A. Actin skeleton-related genes differentially expressed in MafB+/+ control and MafB−/− macrophages by Affymetrix gene array analysis. Gene accession number, number of quadruplicate samples that differed (I, increased; MI, moderately increased), and average change (n-fold) are indicated. B. Quantitative real-time RT-PCR for selected genes on mRNA isolated from pooled MafB+/+ control (n = 3) and MafB−/− (n = 2) in vitro-differentiated macrophage cultures shown as arbitrary units of expression levels. All samples were normalized to HPRT expression, and all expression data were confirmed in at least two independent experiments. Error bars indicate standard errors of the means. C. Western blot analysis of β-actin in serial diluted extracts from MafB+/+ control (n = 3) and MafB−/− (n = 2) in vitro-differentiated macrophage cultures. Tubulin expression is shown as a normalization control.
FIG. 8.
FIG. 8.
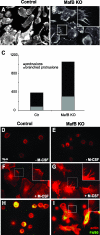
Analysis of actin organization in control and MafB−/− macrophages. A and B. Immunofluorescence images of macrophage cultures differentiated in vitro from E14.5 fetal liver cells of MafB+/+ control (A, n = 2) or MafB−/− (B, n = 2) embryos. Phalloidin staining revealed prominent, often branched actin-containing protrusions in MafB-deficient macrophages (B). C. Quantification of actin-containing protrusions observed in panels A and B, expressed as total numbers of branched and straight protrusions per 100 cells. D to G. MafB+/+ control (D and F) or MafB−/− (E and G) in vitro-differentiated macrophages from three age-matched embryos each were cultured overnight without M-CSF (D and E), restimulated for 5 min with M-CSF (F and G), and analyzed by phalloidin staining for actin organization, showing rapid spreading in both cases but mainly lamellopodial extensions in MafB+/+ control (inset in panel F) and mainly filopodial, often branched, protrusions in MafB−/− macrophages (inset in panel G). H and I. Peritoneal exudate cells from two MafB+/+ control (H) or two MafB−/− (I) reconstituted mice were pooled and cultured for 5 min in M-CSF-containing medium, fixed, and stained with phalloidin to reveal actin organization and anti-F4/80 antibody to identify macrophages. Both F4/80 lymphocytes and F4/80+ macrophages were detected in both samples. MafB−/− macrophages revealed prominent filopodial, often branched, protrusions (I, inset).

Similar articles

Cited by

References

    1. Aggarwal, B. B., and K. Mehta. 1996. Determination and regulation of nitric oxide production from macrophages by lipopolysaccharides, cytokines, and retinoids. Methods Enzymol. 269:166-171. - PubMed
    1. Allen, W. E., G. E. Jones, J. W. Pollard, and A. J. Ridley. 1997. Rho, Rac and Cdc42 regulate actin organization and cell adhesion in macrophages. J. Cell Sci. 110:707-720. - PubMed
    1. Bakri, Y., S. Sarrazin, U. P. Mayer, S. Tillmanns, C. Nerlov, A. Boned, and M. H. Sieweke. 2005. Balance of MafB and PU.1 specifies alternative macrophage or dendritic cell fate. Blood 105:2707-2716. - PubMed
    1. Blanchi, B., L. M. Kelly, J. C. Viemari, I. Lafon, H. Burnet, M. Bevengut, S. Tillmanns, L. Daniel, T. Graf, G. Hilaire, and M. H. Sieweke. 2003. MafB deficiency causes defective respiratory rhythmogenesis and fatal central apnea at birth. Nat. Neurosci. 6:1091-1100. - PubMed
    1. Blanchi, B., and M. H. Sieweke. 2005. Mutations of brainstem transcription factors and central respiratory disorders. Trends Mol. Med. 11:23-30. - PubMed

Publication types

MeSH terms