

Crowding and confinement effects on protein diffusion in vivo
- PMID: 16923878
- PMCID: PMC1595386
- DOI: 10.1128/JB.01982-05
Crowding and confinement effects on protein diffusion in vivo
Abstract
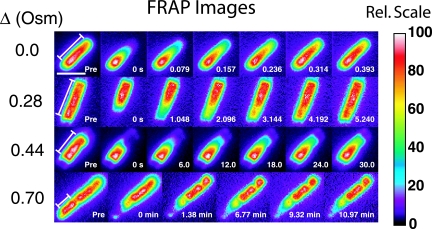
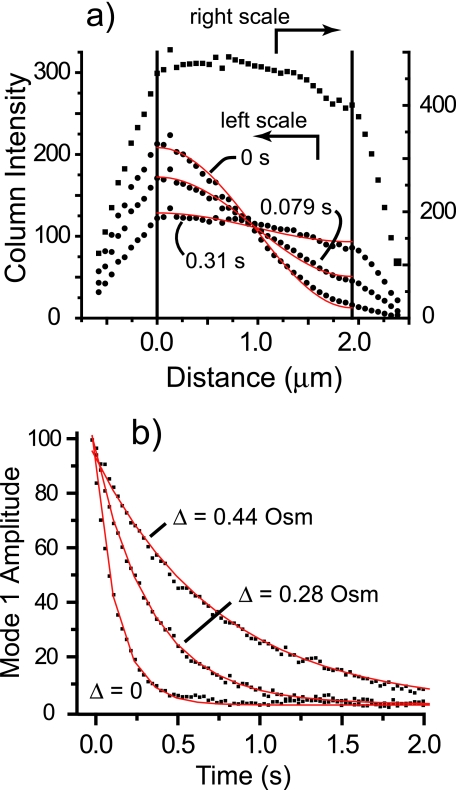
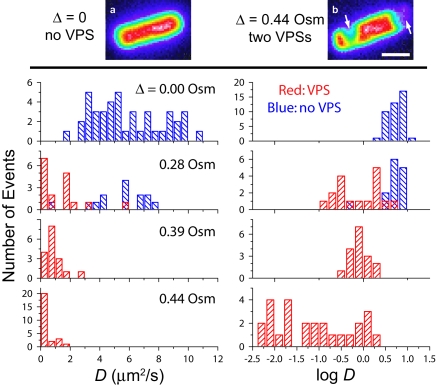
The first in vivo measurements of a protein diffusion coefficient versus cytoplasmic biopolymer volume fraction are presented. Fluorescence recovery after photobleaching yields the effective diffusion coefficient on a 1-mum-length scale of green fluorescent protein within the cytoplasm of Escherichia coli grown in rich medium. Resuspension into hyperosmotic buffer lacking K+ and nutrients extracts cytoplasmic water, systematically increasing mean biopolymer volume fraction, <phi>, and thus the severity of possible crowding, binding, and confinement effects. For resuspension in isosmotic buffer (osmotic upshift, or Delta, of 0), the mean diffusion coefficient, <D>, in cytoplasm (6.1 +/- 2.4 microm2 s(-1)) is only 0.07 of the in vitro value (87 microm2 s(-1)); the relative dispersion among cells, sigmaD/<D> (standard deviation, sigma(D), relative to the mean), is 0.39. Both <D> and sigmaD/<D> remain remarkably constant over the range of Delta values of 0 to 0.28 osmolal. For a Delta value of > or =0.28 osmolal, formation of visible plasmolysis spaces (VPSs) coincides with the onset of a rapid decrease in <D> by a factor of 380 over the range of Delta values of 0.28 to 0.70 osmolal and a substantial increase in sigmaD/<D>. Individual values of D vary by a factor of 9 x 10(4) but correlate well with f(VPS), the fractional change in cytoplasmic volume on VPS formation. The analysis reveals two levels of dispersion in D among cells: moderate dispersion at low Delta values for cells lacking a VPS, perhaps related to variation in phi or biopolymer organization during the cell cycle, and stronger dispersion at high Delta values related to variation in f(VPS). Crowding effects alone cannot explain the data, nor do these data alone distinguish crowding from possible binding or confinement effects within a cytoplasmic meshwork.
Figures


Similar articles
-
Cytoplasmic protein mobility in osmotically stressed Escherichia coli.J Bacteriol. 2009 Jan;191(1):231-7. doi: 10.1128/JB.00536-08. Epub 2008 Oct 24. J Bacteriol. 2009. PMID: 18952804 Free PMC article.
-
Protein diffusion in the periplasm of E. coli under osmotic stress.Biophys J. 2011 Jan 5;100(1):22-31. doi: 10.1016/j.bpj.2010.11.044. Biophys J. 2011. PMID: 21190653 Free PMC article.
-
Decreased Effective Macromolecular Crowding in Escherichia coli Adapted to Hyperosmotic Stress.J Bacteriol. 2019 Apr 24;201(10):e00708-18. doi: 10.1128/JB.00708-18. Print 2019 May 15. J Bacteriol. 2019. PMID: 30833357 Free PMC article.
-
Large changes in cytoplasmic biopolymer concentration with osmolality indicate that macromolecular crowding may regulate protein-DNA interactions and growth rate in osmotically stressed Escherichia coli K-12.J Mol Recognit. 2004 Sep-Oct;17(5):488-96. doi: 10.1002/jmr.695. J Mol Recognit. 2004. PMID: 15362109 Review.
-
Methods of changing biopolymer volume fraction and cytoplasmic solute concentrations for in vivo biophysical studies.Methods Enzymol. 2007;428:487-504. doi: 10.1016/S0076-6879(07)28027-9. Methods Enzymol. 2007. PMID: 17875435 Review.
Cited by
-
Impact of macromolecular crowding on DNA replication.Nat Commun. 2013;4:1615. doi: 10.1038/ncomms2620. Nat Commun. 2013. PMID: 23511479 Free PMC article.
-
A sensor for quantification of macromolecular crowding in living cells.Nat Methods. 2015 Mar;12(3):227-9, 1 p following 229. doi: 10.1038/nmeth.3257. Epub 2015 Feb 2. Nat Methods. 2015. PMID: 25643150
-
Evolutionary advantage of a dissociative search mechanism in DNA mismatch repair.Phys Rev E. 2021 May;103(5-1):052404. doi: 10.1103/PhysRevE.103.052404. Phys Rev E. 2021. PMID: 34134264 Free PMC article.
-
Size- and position-dependent cytoplasm viscoelasticity through hydrodynamic interactions with the cell surface.Proc Natl Acad Sci U S A. 2023 Feb 28;120(9):e2216839120. doi: 10.1073/pnas.2216839120. Epub 2023 Feb 21. Proc Natl Acad Sci U S A. 2023. PMID: 36802422 Free PMC article.
-
Spatial distribution and diffusive motion of RNA polymerase in live Escherichia coli.J Bacteriol. 2011 Oct;193(19):5138-46. doi: 10.1128/JB.00198-11. Epub 2011 Jul 22. J Bacteriol. 2011. PMID: 21784927 Free PMC article.
References
-
- Amsden, B. 1998. Solute diffusion within hydrogels. Mechanisms and models. Macromolecules 31:8382-8395.
-
- Bremer, H., and P. P. Dennis. 1996. Modulation of the chemical composition and other parameters of the cell by growth rate, p. 1553-1569. In F. C. Neidhardt, R. Curtiss III, J. L. Ingraham, E. C. C. Lin, K. B. Low, B. Magasanik, W. S. Reznikoff, M. Riley, M. Schaechter, and H. E. Umbarger (ed.), Escherichia coli and Salmonella: cellular and molecular biology, vol. 2. ASM Press, Washington, D.C.
-
- Cayley, S., and M. T. Record, Jr. 2003. Roles of cytoplasmic osmolytes, water, and crowding in the response of Escherichia coli to osmotic stress: biophysical basis of osmoprotection by glycine betaine. Biochemistry 42:12596-12609. - PubMed
Publication types
MeSH terms
Substances
Grants and funding
LinkOut - more resources
Full Text Sources
Other Literature Sources
