. 2006 Aug 14;174(4):593-604.
doi: 10.1083/jcb.200602080. Epub 2006 Aug 7.

Vascular endothelial cadherin controls VEGFR-2 internalization and signaling from intracellular compartments

Affiliations

Vascular endothelial cadherin controls VEGFR-2 internalization and signaling from intracellular compartments

Maria Grazia Lampugnani et al. J Cell Biol. .

Abstract

Receptor endocytosis is a fundamental step in controlling the magnitude, duration, and nature of cell signaling events. Confluent endothelial cells are contact inhibited in their growth and respond poorly to the proliferative signals of vascular endothelial growth factor (VEGF). In a previous study, we found that the association of vascular endothelial cadherin (VEC) with VEGF receptor (VEGFR) type 2 contributes to density-dependent growth inhibition (Lampugnani, G.M., A. Zanetti, M. Corada, T. Takahashi, G. Balconi, F. Breviario, F. Orsenigo, A. Cattelino, R. Kemler, T.O. Daniel, and E. Dejana. 2003. J. Cell Biol. 161:793-804). In the present study, we describe the mechanism through which VEC reduces VEGFR-2 signaling. We found that VEGF induces the clathrin-dependent internalization of VEGFR-2. When VEC is absent or not engaged at junctions, VEGFR-2 is internalized more rapidly and remains in endosomal compartments for a longer time. Internalization does not terminate its signaling; instead, the internalized receptor is phosphorylated, codistributes with active phospholipase C-gamma, and activates p44/42 mitogen-activated protein kinase phosphorylation and cell proliferation. Inhibition of VEGFR-2 internalization reestablishes the contact inhibition of cell growth, whereas silencing the junction-associated density-enhanced phosphatase-1/CD148 phosphatase restores VEGFR-2 internalization and signaling. Thus, VEC limits cell proliferation by retaining VEGFR-2 at the membrane and preventing its internalization into signaling compartments.


Figures

Figure 1.
Figure 1.
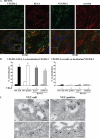
VEC clustering at cell–cell contacts inhibits VEGFR-2 endocytosis. (A) The internalization of VEGFR-2 from the plasma membrane was analyzed in sparse and confluent HUVECs treated with VEGF for 5 min. To detect the internalized receptor, cells were treated with a recombinant single chain antibody to human VEGFR-2, scFvA7, and acid washed before fixation and processing for immunofluorescence microscopy. Internalized VEGFR-2 appears in a vesicular pattern that is more abundant in sparse than in confluent cultures. (bottom) The granular staining after different incubation lengths with VEGF was quantified using the ImageJ program (see Materials and methods). The results (referred to as events per cell) reported in the graph are means ± SD (error bars) of three independent experiments. At least seven random fields were analyzed for each time point in each experiment. (B) VEC-null and -positive confluent cultures were treated as described in A, but the anti–mouse VEGFR-2 clone Avas12α1 was used. The micrographs show a typical vesicular labeling pattern after a 10-min treatment with VEGF. The staining appears more abundant in VEC-null than in VEC-positive cells. (bottom) The time course of vesicular labeling in response to VEGF was analyzed as described in A. The binding of the antibody does not activate VEGFR-2 nor does it induce its internalization (for details see Fig. S5, available at http://www.jcb.org/cgi/content/full/jcb.200602080/DC1). In A and B, nuclei stained with DAPI appear blue. *, P ≤ 0.05; **, P ≤ 0.01 by comparing sparse versus confluent (A, bottom) and VEC-null versus -positive (B, bottom) cells by analysis of variance and the Duncan test. Bars (A), 15 μm; (B) 20 μm.
Figure 2.
Figure 2.
Internalization, degradation, and recycling of biotinylated VEGFR-2 are inhibited in VEC-positive cells. (A) Internalization and recycling of VEGFR-2 was measured after cell surface biotinylation with thiol-cleavable Sulfo-NHS-SS-Biotin. At selected time points, biotin was cleaved by GSH followed by immunoprecipitation of VEGFR-2 and probing with HRP-streptavidin as described in Materials and methods. Recycling was measured as the amount of biotinylated receptor reappearing on the cell surface (and therefore not protected by GSH cleavage) at the indicated time points after 10 min of internalization in the presence of VEGF (indicated as 0 min in recycling panel). Total, total amount of labeled receptor after Sulfo-NHS-SS-Biotin labeling at 4°C (without GSH treatment). GSH, treatment with reducing GSH to remove any labeling on the residual surface-exposed receptor. (B) Densitometric analysis of internalization expressed as a percentage of total labeling. (C and D) Quantitation of receptor degradation and recycling as a percentage of the amount of receptor internalized after 10 min with VEGF. Although A presents a representative experiment, the values in B–D are the means of four independent experiments ± SD (error bars). **, P ≤ 0.01; *, P ≤0.05 comparing VEC-null with -positive cells, respectively, by analysis of variance and the Duncan test.
Figure 3.
Figure 3.
Internalized VEGFR-2 colocalizes with EEA-1–positive compartments by immunofluorescence analysis. HUVECs, VEC-null, and VEC-positive cells were double labeled for VEGFR-2 and either EEA-1 or caveolin-1. Cells were activated with VEGF for 10 min. (A) Representative examples of confocal images for each antigen and their respective merges (boxed areas; 3.5-fold magnification) are shown for confluent HUVECs after treatment with VEGF. VEGFR-2 was revealed with an AlexaFluor488-conjugated secondary antibody and is shown in green. EEA-1 and caveolin revealed with AlexaFluor647-conjugated secondary antibodies are shown in red. Nuclei appear blue after DAPI staining. Bars, 10 μm. (B) To quantify colocalization events, images were analyzed using the ImageJ colocalization plugin (as described in Materials and methods). The graphs present the number of colocalization events normalized for the number of VEGFR-2– positive compartments. After VEGF treatment, ∼45–55% of VEGFR-2–positive compartments showed colocalization with EEA-1 in all of the situations examined. Colocalization of internalized VEGFR-2 with caveolin-1 was negligible. Values are the mean of at least three experiments ± SD (error bars). In each experiment, at least five random fields were analyzed for each point. *, P ≤ 0.01 by t test. (C, a and b) Immunogold labeling of EEA-1 (10 nm gold; arrows) and VEGFR-2 (15 nm gold; arrowheads) on an ultrathin cryosection of VEC-null and -positive cells treated with VEGF for 10 min. The panels display VEGFR-2 labeling of EEA-1–positive endosomes in VEC-null rather than in VEC-positive cells. (c and d) Under the same conditions, morphologically identified caveolae are devoid of VEGFR-2. Bar (a), 227 nm; (b) 222 nm; (c) 350 nm; (d) 370 nm.
Figure 4.
Figure 4.
VEGFR-2 is internalized through a clathrin-dependent pathway. (A) VEC-null and -positive cells were transfected with either Stealth siRNA targeting the mouse clathrin heavy chain or negative Stealth siRNA control duplex (and used 72 h later), or the cells were treated with hypertonic medium (0.45 M sucrose for 30 min) or 1 μg/ml filipin for 1 h. The micrographs show VEGFR-2 immunofluorescence staining after VEGF treatment for 10 min. Both clathrin heavy chain siRNA and hypertonic medium strongly reduced VEGFR-2 vesicular patterning both in VEC-null and -positive cells. Using filipin to interfere with the caveolar compartment had no effect on either cell type. The negative Stealth siRNA control duplex produced results that were indistinguishable from untreated cells (not depicted). Nuclei appear blue after DAPI staining. Bar, 20 μm. (B) Column graphs represent VEGFR-2 vesicular labeling in VEGF-treated cells quantified by ImageJ. Ctr, control; HM, hypertonic medium. Values normalized per cell are the mean of three independent experiments ± SD (error bars). In each experiment, at least five independent fields were analyzed for each point. *, P ≤ 0.01 versus control values by analysis of variance and the Dunnet test.
Figure 5.
Figure 5.
VEC expression reduces the amount of PY–VEGFR-2 in internal compartments. Extracts of VEGF-treated VEC-null and -positive cells were fractionated on an iodixanol gradient as described in Materials and methods. Samples representative of the total protein content of each fraction were analyzed by SDS-PAGE and Western blotting. As expected, VEC concentrates in lower density fractions corresponding to plasmatic membranes, whereas clathrin and EEA-1 are enriched in higher density fractions corresponding to internal membranes (Yeaman et al., 2001). Upon stimulation with VEGF, PY1214–VEGFR-2 is enriched in fractions corresponding to the internal membranes in VEC-null cells. The graph shows the ratio between the phosphorylated receptor and the total receptor present in each fraction. For quantification, in each fraction, we considered the band with the molecular mass of the mature form of the receptor at the plasma membrane (∼210 kD; see fraction 1 and arrowheads; Takahashi and Shibuya, 1997). We chose this band by making the assumption that full-length VEGFR-2 represents the signaling form of the receptor. At increasing density, a lighter band appears both in VEC-null and -positive cells (asterisks). It is likely that this band derives from VEGFR-2 processing in internal compartments (for instance, proteolytic or intermediate synthesis products) and is indeed not present in the peripheral membrane fractions. Comparable results were obtained using an antibody to PY1054/59–VEGFR-2 (not depicted).
Figure 6.
Figure 6.
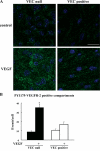
Internalized VEGFR-2 is phosphorylated at tyrosine 1175. (A) VEC-null and -positive cells were stimulated with VEGF as in Fig. 1, fixed, and processed for immunofluorescence microscopy. The vesicular labeling pattern observed with PY1175–VEGFR-2 antibody after stimulation with VEGF was significantly more abundant in VEC-null than in VEC-positive cells. Nuclei appear blue after DAPI staining. Bar, 20 μm. (B) Images were analyzed by ImageJ to quantify PY115–VEGFR-2–positive compartments (see Materials and methods). The graph presents the mean ± SD (error bars) calculated from 18 random fields that were analyzed through ImageJ in five independent experiments and is normalized to the number of cells per field. In each experiment, at least three random fields were analyzed. *, P ≤ 0.01 comparing VEC-null with -positive cells after VEGF by analysis of variance and the Duncan test.
Figure 7.
Figure 7.
Colocalization of internalized VEGFR-2 and activated PLC-γ. (A) VEC-null and -positive cells were labeled in vivo with antibodies to VEGFR-2, stimulated with VEGF as in Fig. 6, acid washed, fixed, and processed for immunofluorescence microscopy. Cells were double labeled with an antibody that recognizes PLC-γ only when phosphorylated at tyrosine 783. VEGFR-2 was revealed with an AlexaFluor488-conjugated secondary antibody and is shown in green. PY783–PLC-γ, which was revealed with an AlexaFluor647-conjugated secondary antibody, is shown in red. For each cell type, the bottom panel on the right (threefold magnification of the boxed areas) shows the colocalization of VEGFR-2 and PY783–PLC-γ (pink) set upon the VEGFR-2 background (gray). This was obtained through the ImageJ colocalization plugin (see Materials and methods for details). Arrows point to the colocalization of PY783–PLC-γ and VEGFR-2. Bars, 10 μm. (B) The confocal images were analyzed through ImageJ to calculate the number of colocalization events. These values, which were normalized over the number of VEGFR-2–positive compartments per cell, are presented in the graph. After VEGF treatment, colocalization was about fivefold higher in VEC-null than in VEC-positive cells. Values in the graph are the mean from three independent experiments ± SD (error bars). In each experiment, each point was calculated from at least five random fields. *, P ≤ 0.01 comparing VEC-null with -positive cells after VEGF by analysis of variance and the Duncan test.
Figure 8.
Figure 8.
Silencing clathrin expression inhibits VEGFR-2 phosphorylation and signaling in VEC-null cells. VEC-null and -positive cells were transfected with Stealth siRNA-targeting mouse clathrin heavy chain. Two oligonucleotides (a and b; respective sequences are reported in Materials and methods) were used that target two independent sequences of the clathrin heavy chain mRNA. Negative Stealth siRNA duplex was used as a control. After 72 h, cells were treated with VEGF or control medium for 10 min. They were then extracted and processed for Western blotting. Clathrin siRNA reduced clathrin heavy chain levels by ∼75 (oligonucleotide a) and 90% (oligonucleotide b) in both cell types. VEGFR-2 phosphorylation at tyrosine 1214 and p44/42 MAPK phosphorylation in response to VEGF were strongly inhibited in VEC-null cells, whereas these parameters were only barely affected in VEC- positive cells. Comparable results were obtained for PY1054/59–VEGFR-2 (not depicted). The graphs show the quantification of these effects as means ± SD (error bars) of five independent experiments. Fold increase after VEGF is shown for PY1214–VEGFR-2 and phospho-p44/42 MAPK. *, P ≤ 0.01 versus negative siRNA by variant analysis and the Dunnet test.
Figure 9.
Figure 9.
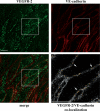
VEC does not codistribute with VEGFR-2 in internal compartments. VEC-positive cells were treated with VEGF for 10 min, double stained for VEGFR-2 and VEC, and analyzed by confocal microscopy. Besides junctional staining, VEC did not show any obvious vesicular pattern. VEGFR-2 and VEC appeared to codistribute only at cell–cell contacts and not in intracellular compartments. The bottom panel on the right (2.6-fold magnification of the boxed areas) shows the colocalization of VEGFR-2 and VEC (yellow) set upon the VEC background (gray). This was obtained through the colocalization plugin of ImageJ (see Materials and methods for details). Arrows point to the junctional colocalization of VEGFR-2 and VEC. Bars, 10 μm.
Figure 10.
Figure 10.
DEP-1/CD148 silencing in VEC-positive cells increases internalization, tyrosine phosphorylation, and activity of VEGFR-2. VEC-positive cells were transfected with either Stealth siRNA-targeting mouse DEP-1/CD148 or a negative Stealth siRNA control duplex. After 72 h, cells were treated with VEGF for 10 min and either fixed and processed for immunofluorescence microscopy or extracted and processed for Western blotting. DEP-1/CD148 siRNA reduced DEP-1/CD148 protein by ∼45% (B). (A) VEGFR-2–positive vesicular compartments were found to be significantly higher (>80%) in VEGF-treated cells after transfection with DEP-1/CD148 siRNA. Means of three independent experiments ± SD (error bars) are shown. In each experiment, at least five random fields were analyzed. *, P ≤ 0.01 comparing negative with DEP-1 siRNA interference by analysis of variance and the Duncan test. (B) Phosphorylation of VEGFR-2 at tyrosine 1214 and of p44/42 MAPK was increased by ∼80 and 60%, respectively, after DEP-1/CD148 siRNA transfection in VEGF-treated cells.

Similar articles

Cited by

References

    1. Akhtar, N., and N.A. Hotchin. 2001. RAC1 regulates adherens junctions through endocytosis of E-cadherin. Mol. Biol. Cell. 12:847–862. - PMC - PubMed
    1. Alitalo, K., T. Tammela, and T.V. Petrova. 2005. Lymphangiogenesis in development and human disease. Nature. 438:946–953. - PubMed
    1. Andriopoulou, P., P. Navarro, A. Zanetti, M.G. Lampugnani, and E. Dejana. 1999. Histamine induces tyrosine phosphorylation of endothelial cell-to-cell adherens junctions. Arterioscler. Thromb. Vasc. Biol. 19:2286– 2297. - PubMed
    1. Bauer, P.M., J. Yu, Y. Chen, R. Hickey, P.N. Bernatchez, R. Looft-Wilson, Y. Huang, F. Giordano, R.V. Stan, and W.C. Sessa. 2005. Endothelial-specific expression of caveolin-1 impairs microvascular permeability and angiogenesis. Proc. Natl. Acad. Sci. USA. 102:204–209. - PMC - PubMed
    1. Baumeister, U., R. Funke, K. Ebnet, H. Vorschmitt, S. Koch, and D. Vestweber. 2005. Association of Csk to VE-cadherin and inhibition of cell proliferation. EMBO J. 24:1686–1695. - PMC - PubMed

Publication types

MeSH terms

Substances