. 2006 Aug 23;25(16):3900-11.
doi: 10.1038/sj.emboj.7601253. Epub 2006 Jul 27.

Nitric oxide-induced mitochondrial fission is regulated by dynamin-related GTPases in neurons

Affiliations

Nitric oxide-induced mitochondrial fission is regulated by dynamin-related GTPases in neurons

Mark J Barsoum et al. EMBO J. .

Abstract

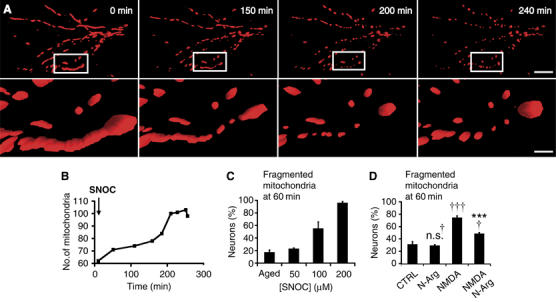
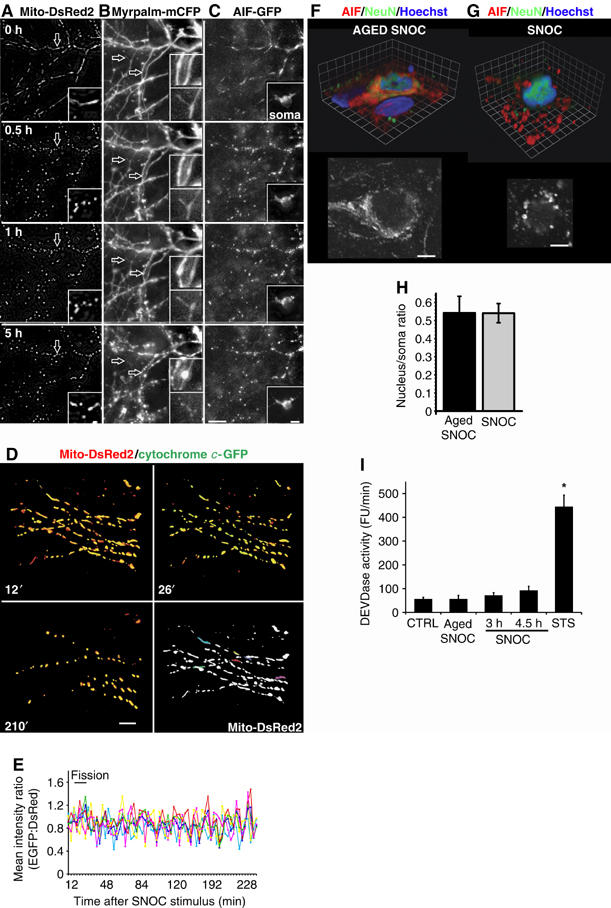
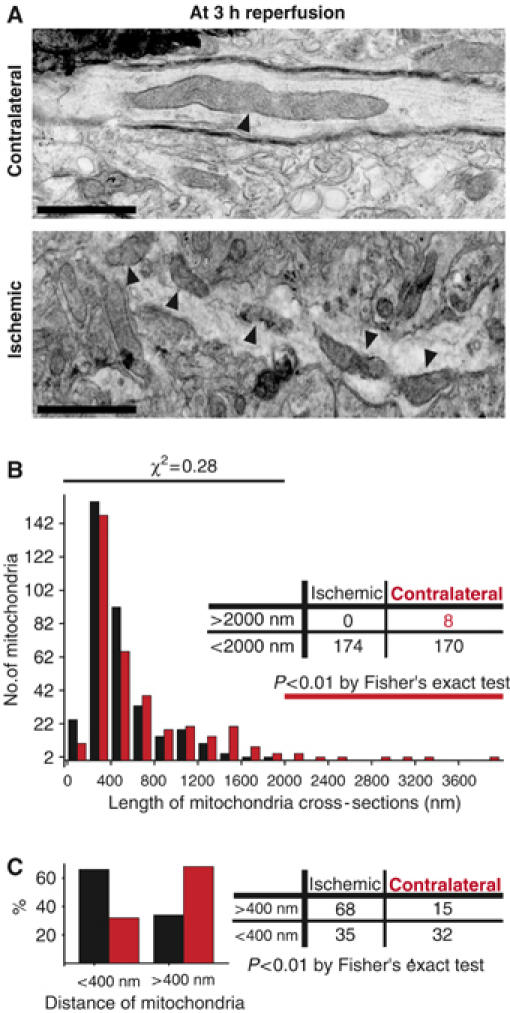
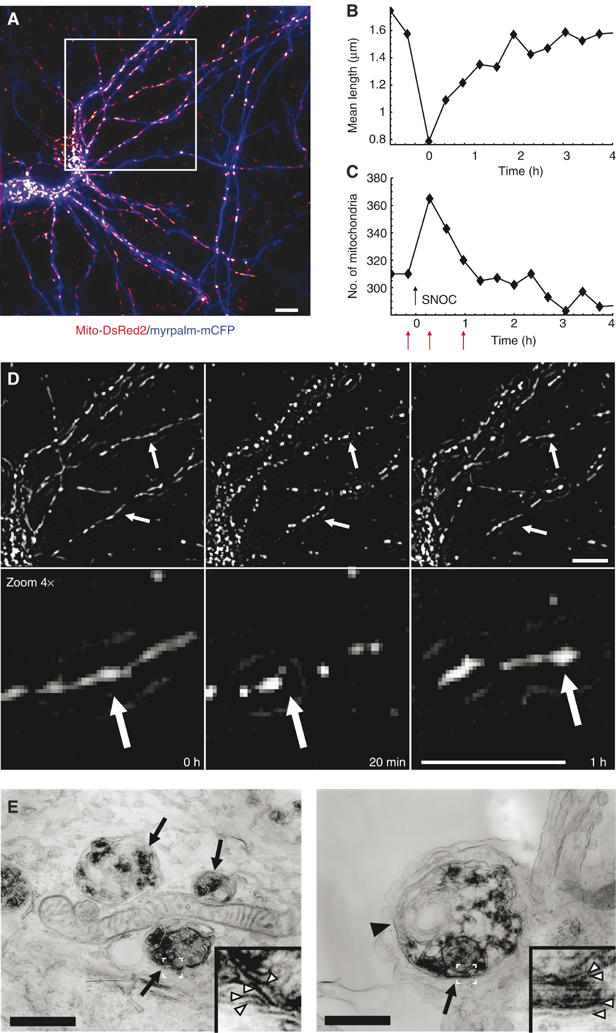
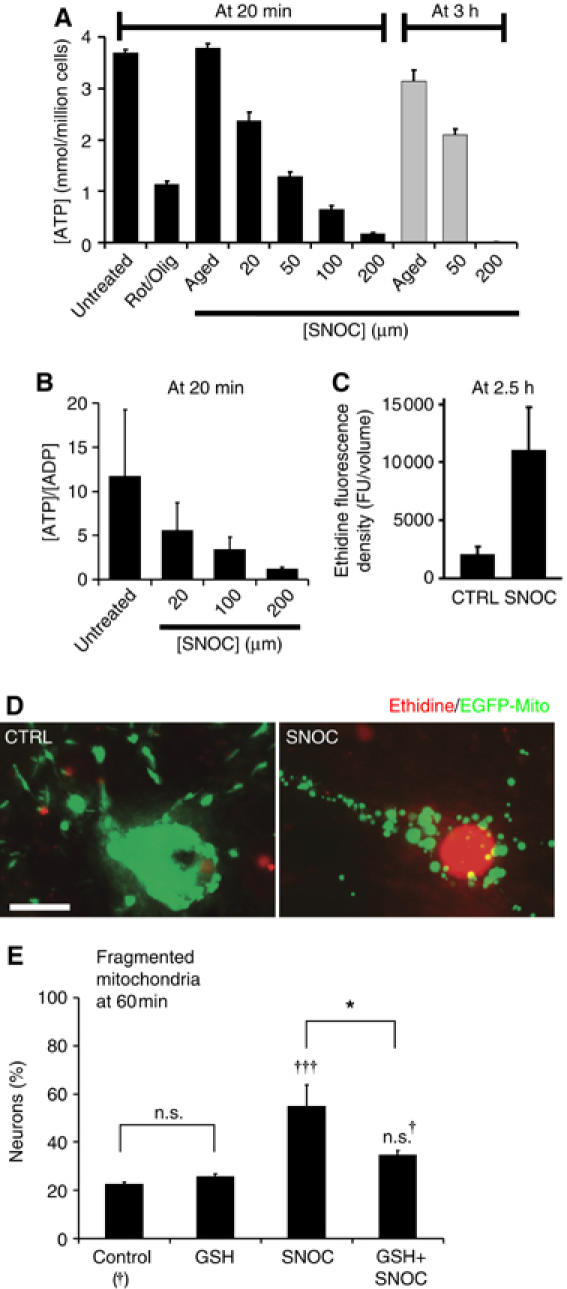
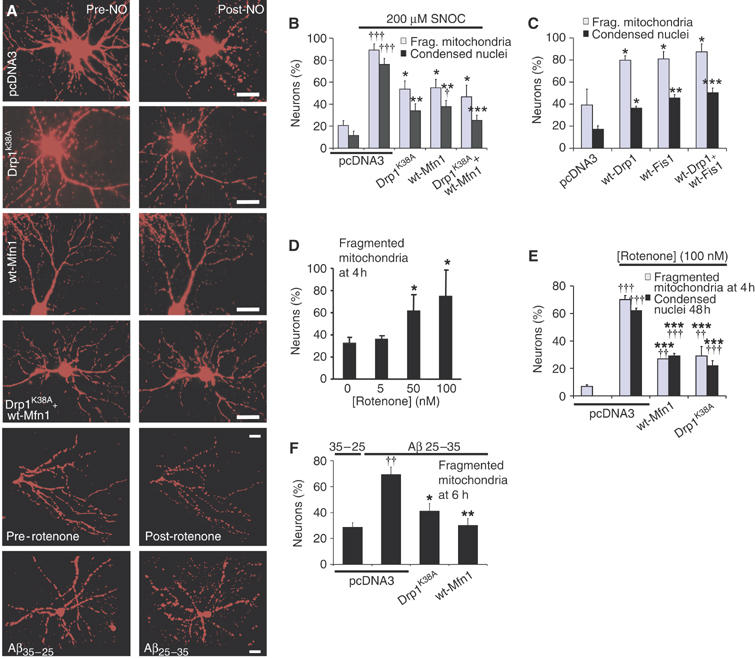
Mitochondria are present as tubular organelles in neuronal projections. Here, we report that mitochondria undergo profound fission in response to nitric oxide (NO) in cortical neurons of primary cultures. Mitochondrial fission by NO occurs long before neurite injury and neuronal cell death. Furthermore, fission is accompanied by ultrastructural damage of mitochondria, autophagy, ATP decline and generation of free radicals. Fission is occasionally asymmetric and can be reversible. Strikingly, mitochondrial fission is also an early event in ischemic stroke in vivo. Mitofusin 1 (Mfn1) or dominant-negative Dynamin related protein 1 (Drp1(K38A)) inhibits mitochondrial fission induced by NO, rotenone and Amyloid-beta peptide. Conversely, overexpression of Drp1 or Fis1 elicits fission and increases neuronal loss. Importantly, NO-induced neuronal cell death was mitigated by Mfn1 and Drp1(K38A). Thus, persistent mitochondrial fission may play a causal role in NO-mediated neurotoxicity.


Figures

Figure 1
Figure 1
NO triggers mitochondrial fission. (A) 3D time-lapse microscopy of mitochondria undergoing fission in a dendritic arbor of a neuron. Neurons were transfected with Mito-DsRed2, pretreated with the pan-caspase inhibitor zVAD-fmk methyl ester (100 μM), and exposed to SNOC (200 μM). Images were 3D iso-surface rendered. Frames depict representative time points of the movie demonstrating mitochondrial fragmentation within 3 h of NO exposure (upper panels; scale bar, 15 μm) and closeup views (lower panels; scale bar, 3 μm). See Supplementary Video 1. (B) Mitochondrial fragmentation within the field of view shown in (A) results in increased mitochondrial numbers. (C) NO induces dose-dependent mitochondrial fission. Neurons expressing Mito-DsRed2 were exposed to SNOC and fixed at 60 min. The fraction of neurons displaying fragmented mitochondria is shown as the mean±s.e.m. (D) Mito-DsRed2-expressing cortical neurons were pretreated with 1 mM nitro-L-arginine (20 min) and exposed to 25 μM NMDA. The fraction of neurons exhibiting fragmented mitochondria at 60 min after NMDA treatment is shown as the mean±s.e.m. of quintuplicate samples from a representative experiment (†††significance at P<0.001 or n.s., not significant compared to control; ***significance at P<0.001 as compared to NMDA treatment).
Figure 2
Figure 2
Mitochondrial fission occurs before dendritic injury and without AIF or cytochrome c release from mitochondria. Neurons were co-transfected with vectors encoding (A) Mito-DsRed2 and (B) MyrPalm-mCFP plus (C) AIF-GFP and the effects of SNOC were recorded using 3D time-lapse imaging. Projection images zoomed in onto the dendritic arbor of one neuron (representative of n=42). Arrows indicate dendritic spines. The inset shows the soma at appropriate grayscale levels. The apparent brightening of AIF-GFP fluorescence in the nucleus at 5 h was due to nuclear and cell body shrinkage rather than nuclear translocation of AIF. Scale bars, 10 μm. See also Supplementary Video 2. (D–E) Neurons transfected with Mito-DsRed2- plus cytochrome c-GFP were exposed to 300 μM SNOC. 3D time-lapse images were captured by fluorescence deconvolution microscopy and analyzed using Volocity software. (D) 3D time-lapse image reconstructions of mitochondria and cytochrome c in a dendritic arbor at indicated time points following SNOC addition. Scale bar, 10 μm. Five mitochondria were selected and motion tracked throughout the imaging series. (E) Traces show the ratio of mean GFP to DsRed2 emission intensity from each mitochondrion. Each trace color corresponds to the same colored mitochondrion. (representative of n=9) (F–G). Immunocytochemistry for staining anti-AIF antibodies (red) anti-NeuN antibodies (green) and nuclei labeled with Hoechst 33342 dye (blue) after (F) aged SNOC or (G) SNOC (150 μM; 4 h) treatment. Volume rendered 3D reconstruction of confocal image stacks are shown above, and a single confocal plane in grayscale below. Grid, 3.3 μm for (F) and 1.9 μm for (G), scale bars, 5 μm. (H) Ratio of nuclear to somal AIF signal was measured as mean fluorescence intensity in the center of nuclei divided by the mean fluorescence intensity in the cell body, outlined by the NeuN staining (excluding the nucleus). The bar diagram summarizes the mean±s.e.m. of 282 and 262 neurons measured in n=19 and 20 image stacks in three independent experiments for aged SNOC and SNOC, respectively (P∼0.99 not significant by Student's t-test). (I) DEVDase activity. Purified cortical neurons were exposed to either 200 μM SNOC or 1 μM staurosporine, as positive control. The rate of zDEVD-AMC caspase substrate cleavage per minute was monitored and expressed in arbitrary fluorescence units. Data show mean±s.e.m. for four independent experiments (*significance at P<0.01 by ANOVA).
Figure 3
Figure 3
Mitochondrial fission in ischemic stroke in vivo. Thin-section electron micrographs from the ischemic penumbral or contralateral brain region of a mouse subjected for 2 h to middle cerebral artery occlusion, followed by 3 h reperfusion. (A) Elongated mitochondrion (arrow) in neuronal process of the unaffected hemisphere (top). Small mitochondrial segments (arrows) are in close proximity to each other in a neuronal process of the ischemic brain region (bottom). Images are representative of three analyzed mice. Scale bars, 500 nm. (B) Histogram comparing mitochondrial cross-section length of contralateral, control (red) and ischemic (black) hemispheres. The lower bins of the histogram (<2000 nm) were compared with χ2-test and were not different. The table shows the presence of long mitochondrial cross-sections (>2000 nm) in the control hemisphere and their absence in the ischemic hemisphere (P<0.01; Fisher's exact test). (C) Proximities of mitochondria comparing the contralateral (red) and ischemic (black) hemispheres. Bar diagram shows percents of mitochondrial proximities found to be smaller or larger than 400 nm. The same data set is summarized as a contingency table on the right, (P<0.001; two-way Fisher's exact test).
Figure 4
Figure 4
Fission is associated with ultrastructural changes in mitochondria. EM tomography of mitochondria in cultured cortical neurons demonstrates injury associated with mitochondrial fission. Cortical cultures were exposed to aged SNOC control (A–D) or 200 μM SNOC (E–L) for 6 h in the presence of 80 μM zVAD-fmk methyl ester. A slice from each tilt series is shown (A, E and I), followed by orthogonal views of 3D reconstructions after segmentation of the OMM (blue) and IMM (gray), with cristae (various arbitrary colors) (B–D, F–H and J–L). For clarity, 10 representative cristae are shown in (B, D, F, G, J and K), while all cristae are displayed in (C, H and L). The control mitochondrion (A–D) is elongated with a dark matrix, indicating no swelling, and 34 cristae. The NO-exposed mitochondrion in (E–H) is dividing, and the lower mitochondrion of the couplet shows severe damage, recognized by an outer membrane rupture, a regionally confined inner membrane blowout, slight matrix swelling and cristae fragmentation. Each of the daughter mitochondria is shorter and rounder than controls. Unlike the upper daughter, few of the cristae extend throughout the lower mitochondrion. Additionally, cristae are considerably smaller and regionally confined. The lower mitochondrion of the couplet contains 82 cristae, while the upper contains only 39, indicating cristae fragmentation in the former. The NO-exposed mitochondrial triplet in (I–L) displays further damage, including membrane degradation, accumulation of an electron dense mass, greater cristae fragmentation, and apparent mitochondrial fragmentation. All cristae are smaller than controls, with 73 in the top mitochondrion, 112 in the middle, and 47 in the bottom. Scale bars, 400 nm. See Supplementary Video 3, 4 and 5 of tomographic reconstruction.
Figure 5
Figure 5
Reversible mitochondrial fission and autophagy. Time lapse fluorescence microscopy of mitochondrial dynamics in response to SNOC (200 μM) of young neurons (DIV 8–10). (A) Projection image of two neurons expressing Mito-DsRed2 (red) and MyrPalm-CFP (blue). Images were high-pass filtered and z-stacks were projected over maximum intensity. (B) Changes in mitochondrial dynamics were evaluated as mean skeletal length of mitochondria or (C) as mitochondrial numbers. (D) Magnified representative frames of the time-lapse recording of the area within the white rectangle of (A) indicate mitochondrial morphology at time 0, 20 min and 1 h. These time points are depicted in (B) and (C) by red arrows. Data are representative of 26 neurons, which exhibited reversible mitochondrial fission from a total of 55 analyzed neurons (six experiments). Scale bar, 10 μm. See Supplementary Video 6. (E) Autophagy in neurites at 6 h after SNOC exposure. Arrows indicate autophagosomes engulfing injured mitochondria next to an intact mitochondrion in the left image. The arrowhead in the right panel indicates membrane wrappers characteristic of autophagosomes. White arrowheads in the insets show the double membranes of the autophagosome and those of mitochondria within the autophagosome. Scale bars, 500 nm.
Figure 6
Figure 6
Fission is associated with bioenergetic failure and free radicals. (A) Mitochondrial fission is linked to a drop in ATP. Purified cortical neurons were exposed to increasing SNOC concentrations or mitochondrial inhibitors (2 μM rotenone plus 2 μg/ml oligomycin; Rot/Olig). ATP concentrations are shown as the mean±s.e.m. normalized to the plating density of neurons (n=6) (B) [ATP]/[ADP] ratios in purified cortical neurons exposed to increasing SNOC concentrations (n=4). (C) The bar graph depicts ethidine fluorescence density in arbitrary units of aged and fresh SNOC treated neurons at 2.5 h. (D) Cortical neurons expressing Mito-GFP (green) were exposed to aged or fresh 200 μM SNOC solution. After 2.5 h cultures were loaded with hydroethidine. Images are representative of more that 20 neurons analyzed (in D) for each condition from at least three independent experiments. Scale bar, 10 μm. (E) Reduced glutathione (GSH) partially blocks mitochondrial fission. Neurons were transfected with Mito-DsRed2 pretreated for 2 h with 2 mM GSH monoethyl ester, washed once and then exposed to 35 μM SNOC. Mitochondrial fission was scored after 1 h. Data are means±s.e.m. of quintuplicate samples from one representative experiment of a total of three (†††significance at P<0.001 or n.s., not significant compared to control; *significance at P<0.05).
Figure 7
Figure 7
Mitochondrial fission is required for neuronal cell death and mediated by Drp1 and Mfn1. Neurons were co-transfected with Mito-DsRed2 plus the plasmids encoding the indicated protein(s). (A) Representative fluorescence micrographs of mitochondrial morphology before and after SNOC (175 μM; 7 h) or rotenone (30 nM; 2 h) treatments and a comparison of the effects of Aβ25–35 versus Aβ35–25 (10 μM, 6 h), as indicated. Scale bar, 20 μm. (B) Percentage of mitochondrial fission and cell death at 18 h ( and ††† significance at P<0.05 and 0.001 as compared to control pcDNA3 transfection; *,** and *** significance at P<0.05 , 0.01 and 0.001, respectively, compared to SNOC treated, pcDNA3 transfected neurons; n=3 independent experiments). Dying neurons were recognized by their shrunken and condensed nuclei after Hoechst 33342 staining. (C) Enforced Drp1 or Fis1 expression (60 h) evokes fission and neuronal cell death (*,** and *** significance at P<0.05, 0.01 and 0.001, respectively, compared to pcDNA3 transfected neurons; n=3 independent experiments). (D) Rotenone induces dose-dependent mitochondrial fission. The fraction of neurons displaying fissioned mitochondria is shown as the mean ±s.e.m. (*significance at P<0.05, n=4). (E) Mfn1 or Drp1K38A inhibits 100 nM rotenone-induced mitochondrial fission (4 h) and cell death (48 h). Data indicate means±s.e.m. of triplicate measurements (†† and ††† significance at P<0.01 and 0.001 as compared to untreated control; ***significance at P<0.001 as compared to rotenone treatment with pcDNA3 transfection; n=3). (F) Mitochondrial fission by Aβ35–25 or Aβ25–35 exposure. The fraction of neurons exhibiting fragmented mitochondria is shown as the mean±s.e.m. (††significance at P<0.01 compared to pcDNA3 transfected, Aβ35−25 treated control; * and ** significance at P<0.05 and 0.001, respectively, compared to pcDNA3 transfected, Aβ25–35 treated neurons; n=3).

Similar articles

Cited by

References

    1. Beal MF (2000) Energetics in the pathogenesis of neurodegenerative diseases. Trends Neurosci 23: 298–304 - PubMed
    1. Bereiter-Hahn J, Voth M (1994) Dynamics of mitochondria in living cells: shape changes, dislocations, fusion, and fission of mitochondria. Microsc Res Tech 27: 198–219 - PubMed
    1. Betarbet R, Sherer TB, MacKenzie G, Garcia-Osuna M, Panov AV, Greenamyre JT (2000) Chronic systemic pesticide exposure reproduces features of Parkinson's disease. Nat Neurosci 3: 1301–1306 - PubMed
    1. Boje KM (2004) Nitric oxide neurotoxicity in neurodegenerative diseases. Front Biosci 9: 763–776 - PubMed
    1. Bonfoco E, Krainc D, Ankarcrona M, Nicotera P, Lipton SA (1995) Apoptosis and necrosis: two distinct events induced, respectively, by mild and intense insults with N-methyl-D-aspartate or nitric oxide/superoxide in cortical cell cultures. Proc Natl Acad Sci USA 92: 7162–7166 - PMC - PubMed

Publication types

MeSH terms