. 2006 Jul 31;174(3):403-13.
doi: 10.1083/jcb.200601102. Epub 2006 Jul 24.

Mannose receptor regulates myoblast motility and muscle growth

Affiliations

Mannose receptor regulates myoblast motility and muscle growth

Katie M Jansen et al. J Cell Biol. .

Abstract

Myoblast fusion is critical for the formation, growth, and maintenance of skeletal muscle. The initial formation of nascent myotubes requires myoblast-myoblast fusion, but further growth involves myoblast-myotube fusion. We demonstrate that the mannose receptor (MR), a type I transmembrane protein, is required for myoblast-myotube fusion. Mannose receptor (MR)-null myotubes were small in size and contained a decreased myonuclear number both in vitro and in vivo. We hypothesized that this defect may arise from a possible role of MR in cell migration. Time-lapse microscopy revealed that MR-null myoblasts migrated with decreased velocity during myotube growth and were unable to migrate in a directed manner up a chemoattractant gradient. Furthermore, collagen uptake was impaired in MR-null myoblasts, suggesting a role in extracellular matrix remodeling during cell motility. These data identify a novel function for MR during skeletal muscle growth and suggest that myoblast motility may be a key aspect of regulating myotube growth.


Figures
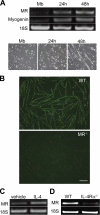
Figure 1.
Figure 1.
MR is expressed in muscle cells during myoblast fusion. (A) Primary myoblasts (Mb) were induced to differentiate for 24 or 48 h. MR mRNA was analyzed by RT-PCR. Myogenin mRNA was assessed as a marker of myogenic differentiation. Phase-contrast images of muscle cells are shown to illustrate fusion progress at each time point. MR, 390 bp; Myogenin, 266 bp; 18S, 488 bp. (B) Representative images of muscle cells after 24 h of differentiation immunostained with an antibody against MR. Bar, 50 μm. (C) Primary myoblasts were differentiated for 24 h and subsequently treated with vehicle or 10 ng/ml IL-4 for 24 h. MR mRNA was analyzed by RT-PCR. (D) MR mRNA expression in WT or IL-4 receptor α-null (IL-4Rα−/−) myotubes after 48 h in DM was examined by RT-PCR. MR, 390 bp; 18S, 488 bp. Representative ethidium bromide staining of agarose gels is shown with 18S ribosomal RNA as an internal control for all RT-PCR analyses. All data are indicative of results from three independent cell isolates.
Figure 2.
Figure 2.
MR is required for the second phase of myoblast fusion in vitro. (A) WT and MR−/− myoblasts were induced to differentiate in DM for 20 or 48 h, followed by immunostaining for eMyHC. Bar, 60 μm. (B) Myogenin levels in WT and MR−/− cells were assessed by immunoblot analysis of cell lysates collected after 0 or 16 h in DM. Coomassie staining of the membrane is shown to demonstrate equal loading. (C) The percentage of nuclei within eMyHC+ WT and MR−/− cells was calculated after 48 h in DM. (D) The percentage of nuclei within WT and MR−/− myotubes (≥2 nuclei) was calculated after 48 h in DM. (E) The number of nuclei in individual WT and MR−/− myotubes (≥2 nuclei) was analyzed after 20, 48, or 72 h in DM. The mean number of myonuclei is decreased in MR−/− myotubes compared with WT at 48 h. Data are mean ± SEM for three independent cell isolates. *, P < 0.05.
Figure 3.
Figure 3.
Myofiber XSA and myonuclear number are decreased in MR−/− muscle. (A) Representative sections of WT and MR−/− TA muscles stained with H&E. Bar, 60 μm. (B) Mean myofiber XSA was calculated for WT and MR−/− TA muscles. The mean XSA of MR−/− TA myofibers is reduced by 23% compared with WT. Data are mean ± SEM. n = 5–6 per genotype. *, P < 0.01. (C) Frequency histogram showing the distribution of myofiber XSA in WT (n = 943 myofibers) and MR−/− (n = 1,057 myofibers) TA muscles. (D) The mean myonuclear number of MR−/− TA myofibers is reduced by ∼34% compared with WT. Data are mean ± SEM. n = 5 for each genotype. *, P < 0.05. (E) Mean myofiber XSA was calculated for WT and MR−/− soleus muscles. The mean XSA of MR−/− soleus myofibers is reduced by 14% compared with WT. Data are mean ± SEM. n = 5 for each genotype. *, P < 0.05. (F) No difference is observed in the mean number of myofibers per soleus muscle of WT and MR−/− mice. Data are mean ± SEM. n = 5 for each genotype.
Figure 4.
Figure 4.
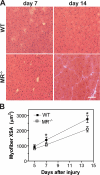
MR is required for normal muscle regeneration after injury. (A) At days 7 and 14 after BaCl2 injury, WT and MR−/− TA sections were stained with H&E. Representative sections are shown. Bar, 50 μm. (B) The XSA of regenerating myofibers was analyzed 5, 7, or 14 d after injury. The mean XSA of MR−/− myofibers 7 and 14 d after injury is significantly reduced compared with WT. Data are mean ± SEM. n = 5–6 per time point for each genotype. *, P < 0.001.
Figure 5.
Figure 5.
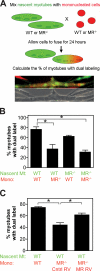
MR is required in mononucleated cells for normal fusion with nascent myotubes. (A) WT or MR−/− nascent myotubes were labeled with a green fluorescent dye and mixed with WT or MR−/− mononucleated cells labeled with a red fluorescent dye. After 24 h in DM, myotubes were fixed and analyzed for dual labeling. A representative myotube with dual labels is shown. (B) The percentage of myotubes with dual labels was calculated for each mixing experiment as indicated. The percentage of myotubes with dual labeling was significantly reduced when WT nascent myotubes were mixed with MR−/− mononucleated cells compared with WT mononucleated cells. (C) Retroviral-mediated expression of MR (MR RV) in MR−/− mononucleated cells rescues the defect in fusion with WT nascent myotubes. Data are mean ± SEM for three independent cell isolates. *, P < 0.05.
Figure 6.
Figure 6.
MR is required for efficient muscle cell motility. (A) After 24 h in DM, time-lapse photographs of WT and MR−/− cells were taken every 5 min for 3 h. The migratory paths of individual mononucleated cells are shown. Paths of 10 cells from each of three independent cell isolates for each genotype were pooled for a total of 30 cell paths. (B) The mean velocities of WT and MR−/− cells were pooled from three independent cell isolates at 0–3 h or 24–27 h in DM. The mean velocity of MR−/− cells is reduced by 23% compared with WT from 24–27 h in DM. Data are mean ± SEM. n = 45–50 cells. *, P < 0.0001. (C) Frequency histogram showing the distribution of velocities for WT and MR−/− cells. (D) MR−/− cells were infected with control or MR RV. After 24 h in DM, time-lapse photographs were taken every 5 min for 3 h. The mean velocities were pooled from three independent cell isolates. RV-mediated MR expression significantly increases the velocity of MR−/− cells. Data are mean ± SEM. *, P < 0.05.
Figure 7.
Figure 7.
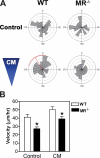
MR is required for directional migration up a gradient of conditioned media. WT or MR−/− cells were differentiated for 24 h and assayed for migration in Dunn chemotaxis chambers. Cell migration over 3 h was recorded using time-lapse photography in the presence of control media or a gradient of conditioned media (CM). For each genotype, data were pooled from three independent isolates. (A) Cell directionality was determined using the horizon distance method and the Rayleigh test for unimodal clustering. The circular histograms indicate the proportion of cells with a migratory trajectory lying within each 18° interval. The mean direction and 95% confidence intervals (red line and arc) are shown for conditions in which significant clustering of cell migration occurs. The directionalities of 45 cells were analyzed in each condition, and graphs depict data from 23 cells. (B) The mean velocity of MR−/− cells was 37% lower than WT cells in control media and 29% lower in conditioned media. Data are mean ± SEM. n = 45–50 cells for each condition. *, P < 0.05.
Figure 8.
Figure 8.
Collagen uptake is reduced in MR-null muscle cells. After differentiating for 24 h, WT and MR−/− cells were incubated with 1 nM 125I-labeled type IV collagen in DM for 4 h. Cell surface bound collagen was released by collagenase treatment, and internalized collagen was assessed using a gamma counter and expressed as counts per minute (cpm). Collagen internalization is reduced by 30% in MR−/− cells. Data are mean ± SEM for three independent cell isolates. *, P < 0.05.

Similar articles

Cited by

References

    1. Abbott, K.L., B.B. Friday, D. Thaloor, T.J. Murphy, and G.K. Pavlath. 1998. Activation and cellular localization of the cyclosporine A-sensitive transcription factor NF-AT in skeletal muscle cells. Mol. Biol. Cell. 9:2905–2916. - PMC - PubMed
    1. Allen, D.L., R.R. Roy, and V.R. Edgerton. 1999. Myonuclear domains in muscle adaptation and disease. Muscle Nerve. 22:1350–1360. - PubMed
    1. Birchmeier, C., and H. Brohmann. 2000. Genes that control the development of migrating muscle precursor cells. Curr. Opin. Cell Biol. 12:725–730. - PubMed
    1. Bischoff, R. 1997. Chemotaxis of skeletal muscle satellite cells. Dev. Dyn. 208:505–515. - PubMed
    1. Bondesen, B.A., S.T. Mills, K.M. Kegley, and G.K. Pavlath. 2004. The COX-2 pathway is essential during early stages of skeletal muscle regeneration. Am. J. Physiol. Cell Physiol. 287:C475–C483. - PubMed

Publication types

MeSH terms