

Autoreactive MZ and B-1 B-cell activation by Faslpr is coincident with an increased frequency of apoptotic lymphocytes and a defect in macrophage clearance
- PMID: 16861350
- PMCID: PMC1895857
- DOI: 10.1182/blood-2005-12-006858
Autoreactive MZ and B-1 B-cell activation by Faslpr is coincident with an increased frequency of apoptotic lymphocytes and a defect in macrophage clearance
Abstract
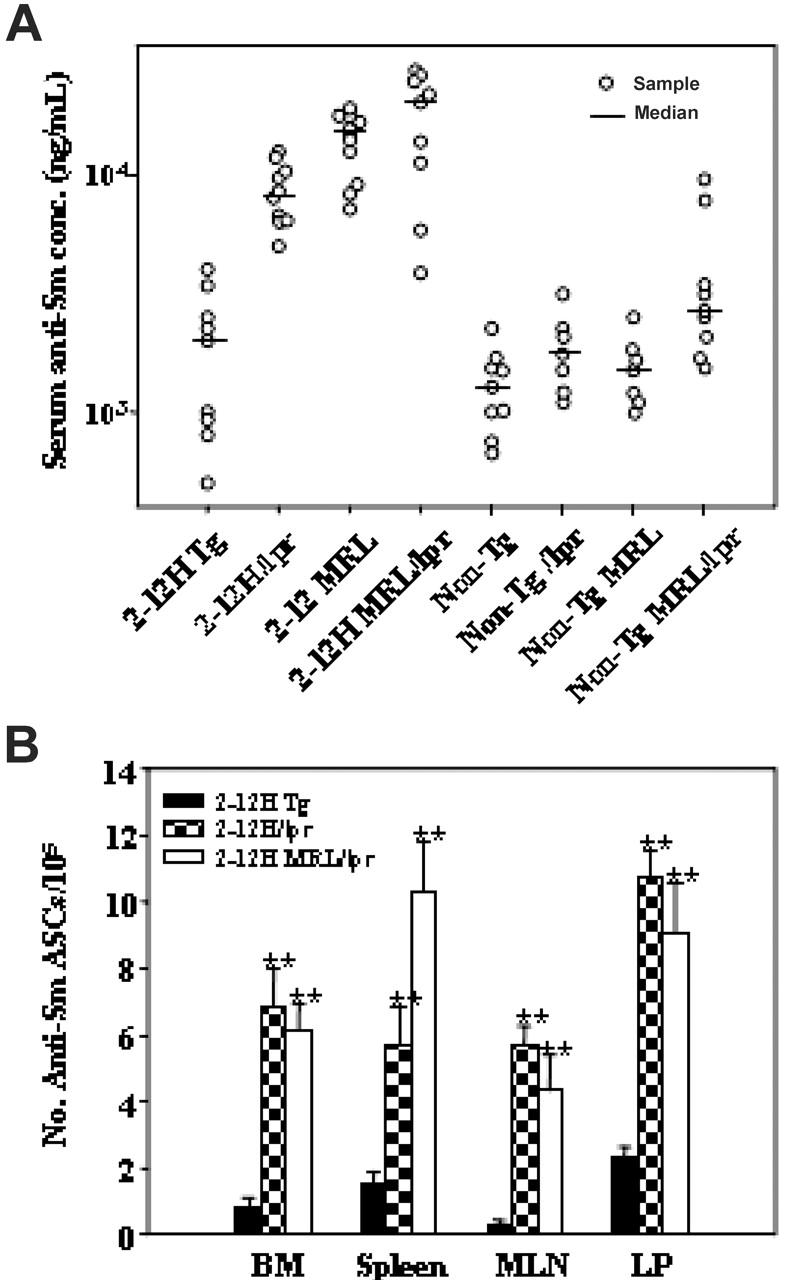
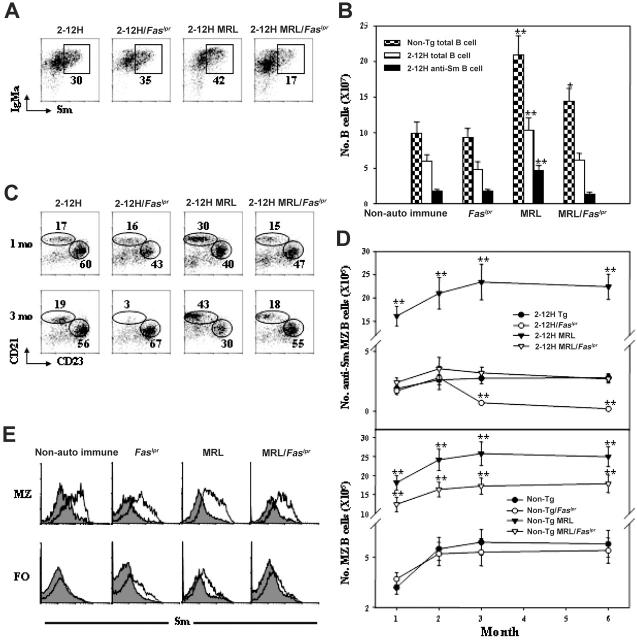
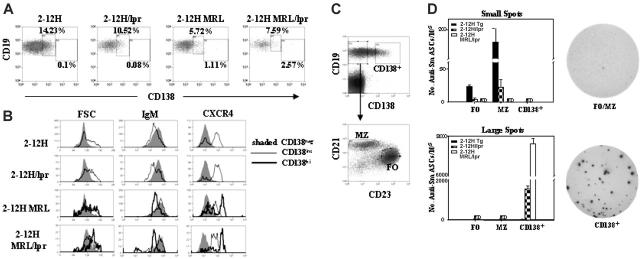
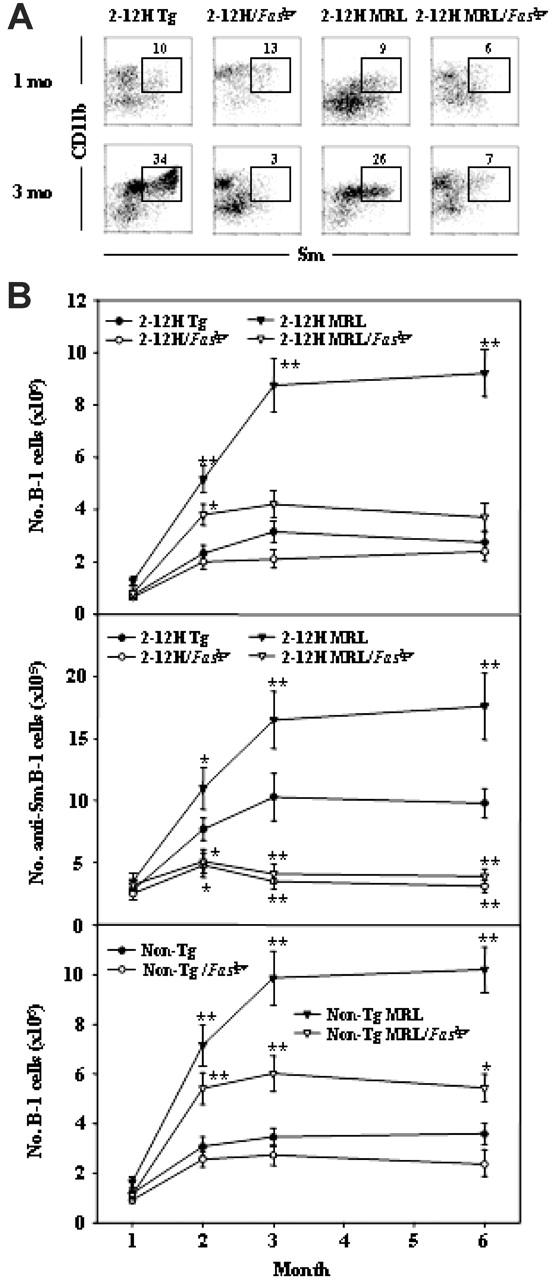
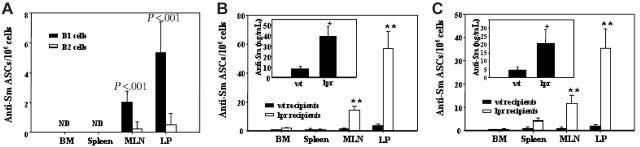
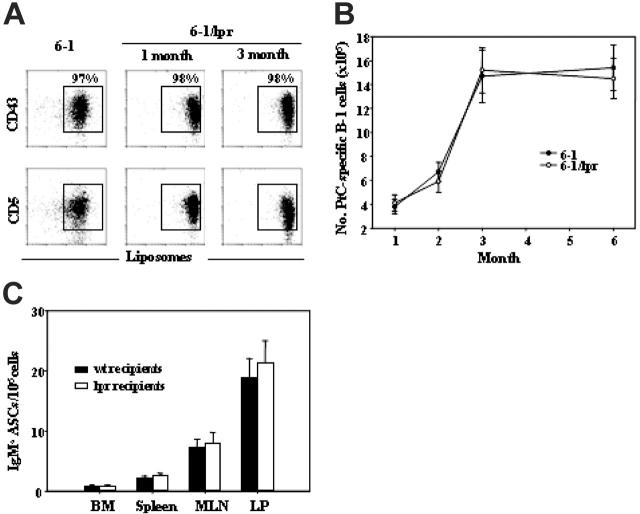
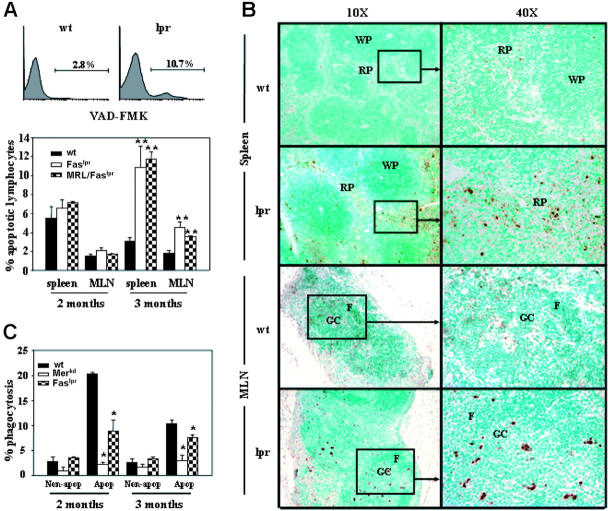
Murine autoreactive anti-Smith (Sm) B cells are negatively regulated by anergy and developmental arrest, but are also positively selected into the marginal zone (MZ) and B-1 B-cell populations. Despite positive selection, anti-Sm production occurs only in autoimmune-prone mice. To investigate autoreactive B-cell activation, an anti-Sm transgene was combined with the lpr mutation, a mutation of the proapoptotic gene Fas (Fas(lpr)), on both autoimmune (MRL) and nonautoimmune backgrounds. Fas(lpr) induces a progressive and autoantigen-specific loss of anti-Sm MZ and B-1 B cells in young adult Fas(lpr) and MRL/Fas(lpr) mice that does not require that Fas(lpr) be B-cell intrinsic. This loss is accompanied by a bypass of the early pre-plasma cell (PC) tolerance checkpoint. Although the MRL bkg does not lead to a progressive loss of anti-Sm MZ or B-1 B cells, it induces a robust bypass of the early pre-PC tolerance checkpoint. Fas(lpr) mice have a high frequency of apoptotic lymphocytes in secondary lymphoid tissues and a macrophage defect in apoptotic cell phagocytosis. Since Sm is exposed on the surface of apoptotic cells, we propose that anti-Sm MZ and B-1 B-cell activation is the result of a Fas(lpr)-induced defect in apoptotic cell clearance.
Figures
Similar articles
-
Rapid B cell apoptosis induced by antigen receptor ligation does not require Fas (CD95/APO-1), the adaptor protein FADD/MORT1 or CrmA-sensitive caspases but is defective in both MRL-+/+ and MRL-lpr/lpr mice.Int Immunol. 2000 Apr;12(4):517-26. doi: 10.1093/intimm/12.4.517. Int Immunol. 2000. PMID: 10744653
-
MRL-lpr/lpr mice exhibit a defect in maintaining developmental arrest and follicular exclusion of anti-double-stranded DNA B cells.J Exp Med. 1999 Jun 7;189(11):1799-814. doi: 10.1084/jem.189.11.1799. J Exp Med. 1999. PMID: 10359584 Free PMC article.
-
Lymphoid cell accumulation in salivary glands of autoimmune MRL mice can be due to impaired apoptosis.Scand J Immunol. 1997 Oct;46(4):373-8. doi: 10.1046/j.1365-3083.1997.d01-142.x. Scand J Immunol. 1997. PMID: 9350288
-
Apoptosis defects analyzed in TcR transgenic and fas transgenic lpr mice.Int Rev Immunol. 1994;11(4):321-42. doi: 10.3109/08830189409051178. Int Rev Immunol. 1994. PMID: 7528763 Review.
-
Unique site of autoantibody production in Fas-deficient mice.Ann N Y Acad Sci. 1997 Apr 5;815:218-29. doi: 10.1111/j.1749-6632.1997.tb52063.x. Ann N Y Acad Sci. 1997. PMID: 9186658 Review.
Cited by
-
The role of tyrosine kinases in systemic lupus erythematosus and their potential as therapeutic targets.Expert Rev Clin Immunol. 2014 May;10(5):573-82. doi: 10.1586/1744666X.2014.893827. Epub 2014 Mar 29. Expert Rev Clin Immunol. 2014. PMID: 24678775 Free PMC article. Review.
-
New insights into immune mechanisms of antiperlecan/LG3 antibody production: Importance of T cells and innate B1 cells.Am J Transplant. 2019 Mar;19(3):699-712. doi: 10.1111/ajt.15082. Epub 2018 Sep 17. Am J Transplant. 2019. PMID: 30129231 Free PMC article.
-
Apoptotic cells promote their own clearance and immune tolerance through activation of the nuclear receptor LXR.Immunity. 2009 Aug 21;31(2):245-58. doi: 10.1016/j.immuni.2009.06.018. Epub 2009 Jul 30. Immunity. 2009. PMID: 19646905 Free PMC article.
-
Oxidation-specific epitopes are dominant targets of innate natural antibodies in mice and humans.J Clin Invest. 2009 May;119(5):1335-49. doi: 10.1172/JCI36800. Epub 2009 Apr 13. J Clin Invest. 2009. PMID: 19363291 Free PMC article.
-
The Fas/CD95 Receptor Regulates the Death of Autoreactive B Cells and the Selection of Antigen-Specific B Cells.Front Immunol. 2012 Jul 25;3:207. doi: 10.3389/fimmu.2012.00207. eCollection 2012. Front Immunol. 2012. PMID: 22848207 Free PMC article.
References
-
- Kono DH, Theofilopoulos AN. Genetics of systemic autoimmunity in mouse models of lupus. Int Rev Immunol. 2000;19: 367-387. - PubMed
-
- Kakkanaiah VN, Sobel ES, MacDonald GC, Cheek RL, Cohen PL, Eisenberg RA. B cell genotype determines the fine specificity of autoantibody in lpr mice. J Immunol. 1997;159: 1027-1035. - PubMed
-
- Watanabe-Fukunaga R, Brannan CI, Copeland NG, Jenkins NA, Nagata S. Lymphoproliferation disorder in mice explained by defects in Fas antigen that mediates apoptosis. Nature. 1992;356: 314-317. - PubMed
-
- Rieux-Laucat F, Le Deist F, Hivroz C, et al. Mutations in Fas associated with human lymphoproliferative syndrome and autoimmunity. Science. 1995;268: 1347-1349. - PubMed
Publication types
MeSH terms
Substances
Grants and funding
LinkOut - more resources
Full Text Sources
Molecular Biology Databases
Research Materials
Miscellaneous
