

Molecular view of water dynamics near model peptides
- PMID: 16852609
- PMCID: PMC2684815
- DOI: 10.1021/jp051137k
Molecular view of water dynamics near model peptides
Abstract
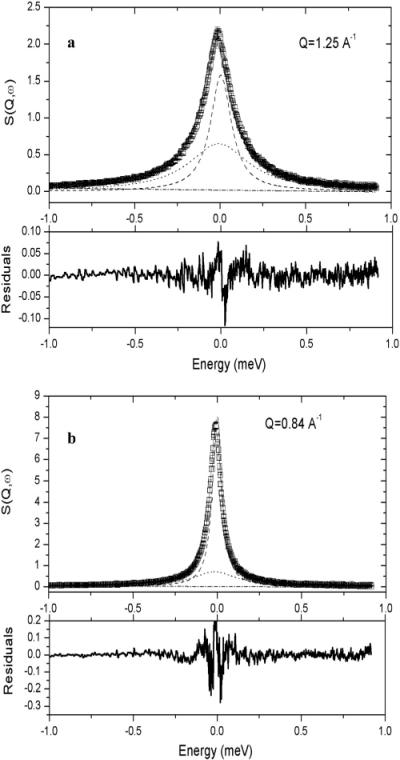
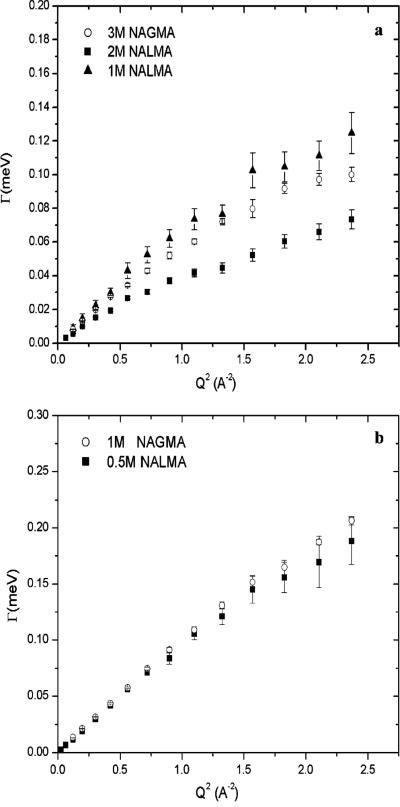
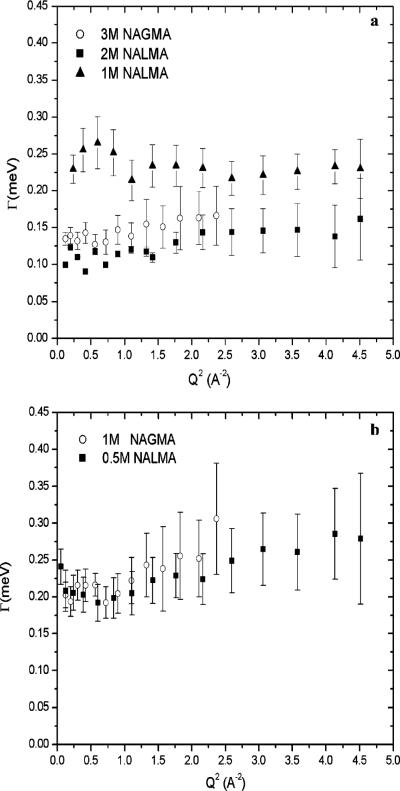
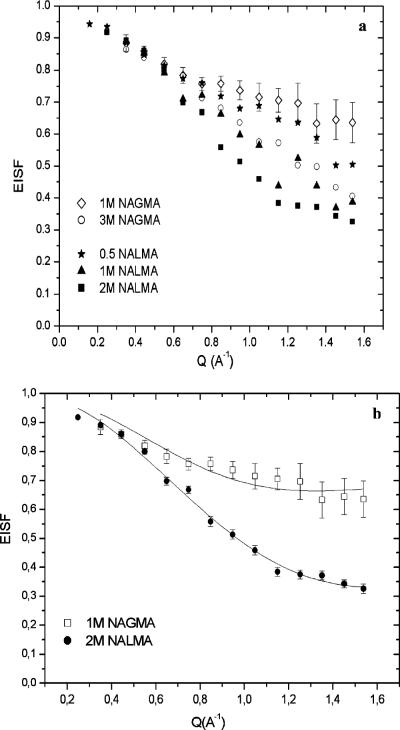
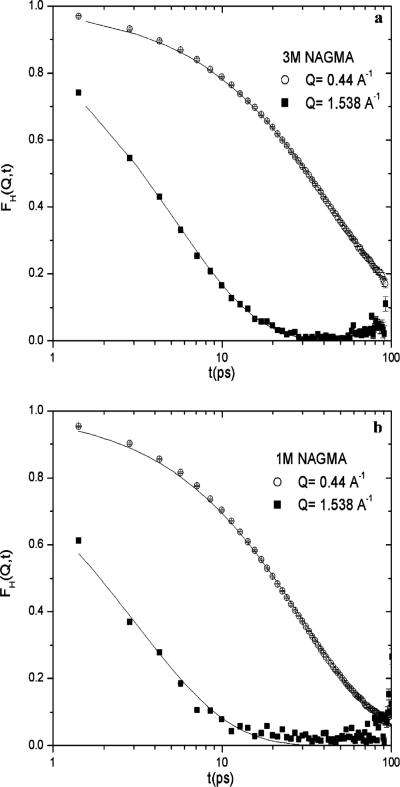
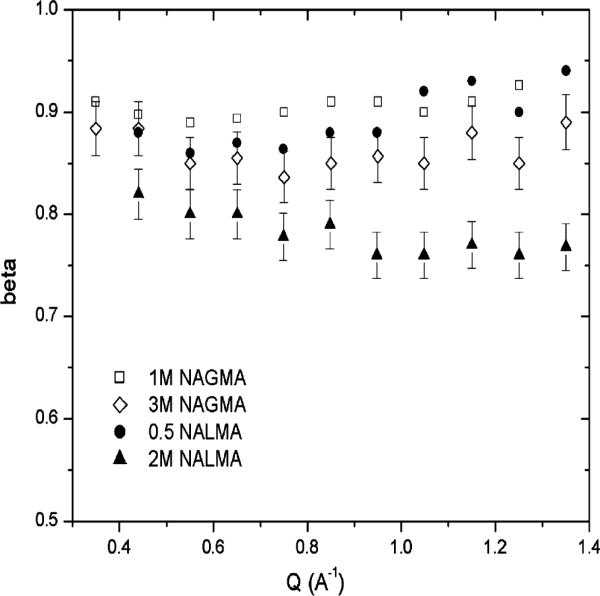
Incoherent quasi-elastic neutron scattering (QENS) has been used to measure the dynamics of water molecules in solutions of a model protein backbone, N-acetyl-glycine-methylamide (NAGMA), as a function of concentration, for comparison with results for water dynamics in aqueous solutions of the N-acetyl-leucine-methylamide (NALMA) hydrophobic peptide at comparable concentrations. From the analysis of the elastic incoherent structure factor, we find significant fractions of elastic intensity at high and low concentrations for both solutes, which corresponds to a greater population of protons with rotational time scales outside the experimental resolution (>13 ps). The higher-concentration solutions show a component of the elastic fraction that we propose is due to water motions that are strongly coupled to the solute motions, while for low-concentration solutions an additional component is activated due to dynamic coupling between inner and outer hydration layers. An important difference between the solute types at the highest concentration studied is found from stretched exponential fits to their experimental intermediate scattering functions, showing more pronounced anomalous diffusion signatures for NALMA, including a smaller stretched exponent beta and a longer structural relaxation time tau than those found for NAGMA. The more normal water diffusion exhibited near the hydrophilic NAGMA provides experimental support for an explanation of the origin of the anomalous diffusion behavior of NALMA as arising from frustrated interactions between water molecules when a chemical interface is formed upon addition of a hydrophobic side chain, inducing spatial heterogeneity in the hydration dynamics in the two types of regions of the NALMA peptide. We place our QENS measurements on model biological solutes in the context of other spectroscopic techniques and provide both confirming as well as complementary dynamic information that attempts to give a unifying molecular view of hydration dynamics signatures near peptides and proteins.
Figures
Similar articles
-
Hydration dynamics near a model protein surface.Biophys J. 2004 Mar;86(3):1852-62. doi: 10.1016/S0006-3495(04)74252-6. Biophys J. 2004. PMID: 14990511 Free PMC article.
-
Water hydrogen bond analysis on hydrophilic and hydrophobic biomolecule sites.Phys Chem Chem Phys. 2008 Aug 28;10(32):4968-74. doi: 10.1039/b807551b. Epub 2008 Jul 9. Phys Chem Chem Phys. 2008. PMID: 18688541
-
Single particle and collective hydration dynamics for hydrophobic and hydrophilic peptides.J Chem Phys. 2007 Jun 7;126(21):215101. doi: 10.1063/1.2737050. J Chem Phys. 2007. PMID: 17567218
-
Dynamics of hydration water in proteins.Gen Physiol Biophys. 2009 Jun;28(2):168-73. doi: 10.4149/gpb_2009_02_168. Gen Physiol Biophys. 2009. PMID: 19592713 Review.
-
Incoherent Neutron Scattering and Terahertz Time-Domain Spectroscopy on Protein and Hydration Water.Life (Basel). 2023 Jan 23;13(2):318. doi: 10.3390/life13020318. Life (Basel). 2023. PMID: 36836676 Free PMC article. Review.
Cited by
-
A peptide's perspective of water dynamics.Chem Phys. 2011 Nov 18;390(1):1-13. doi: 10.1016/j.chemphys.2011.07.018. Epub 2011 Aug 11. Chem Phys. 2011. PMID: 22844177 Free PMC article.
-
Nonlinear scaling of surface water diffusion with bulk water viscosity of crowded solutions.J Am Chem Soc. 2013 Mar 20;135(11):4175-8. doi: 10.1021/ja3112912. Epub 2013 Mar 11. J Am Chem Soc. 2013. PMID: 23347324 Free PMC article.
-
Comparison of the structural stability and dynamic properties of recombinant anthrax protective antigen and its 2-fluorohistidine-labeled analogue.J Pharm Sci. 2012 Nov;101(11):4118-28. doi: 10.1002/jps.23294. Epub 2012 Aug 21. J Pharm Sci. 2012. PMID: 22911632 Free PMC article.
-
The Hydrophobic Effect Studied by Using Interacting Colloidal Suspensions.Int J Mol Sci. 2023 Jan 19;24(3):2003. doi: 10.3390/ijms24032003. Int J Mol Sci. 2023. PMID: 36768326 Free PMC article.
-
Amide Spectral Fingerprints are Hydrogen Bonding-Mediated.J Phys Chem Lett. 2022 Jul 7;13(26):6200-6207. doi: 10.1021/acs.jpclett.2c01277. Epub 2022 Jun 30. J Phys Chem Lett. 2022. PMID: 35770492 Free PMC article.
References
-
- Rupley JA, Careri G. Adv. Protein Chem. 1991;41:37. - PubMed
-
- Bellissentfunel MC, Teixeira J, Bradley KF, Chen SH. J. Phys. I. 1992;2:995.
-
- Bellissentfunel MC, Zanotti JM, Chen SH. Faraday Discuss. 1996;103:281.
-
- Settles M, Doster W. Faraday Discuss. 1996;103:269.
-
- Cheng YK, Rossky PJ. Nature. 1998;392:696. - PubMed
Publication types
MeSH terms
Substances
Grants and funding
LinkOut - more resources
Full Text Sources
