

Detailed map of oxidative post-translational modifications of human p21ras using Fourier transform mass spectrometry
- PMID: 16841939
- PMCID: PMC3098383
- DOI: 10.1021/ac060525v
Detailed map of oxidative post-translational modifications of human p21ras using Fourier transform mass spectrometry
Abstract
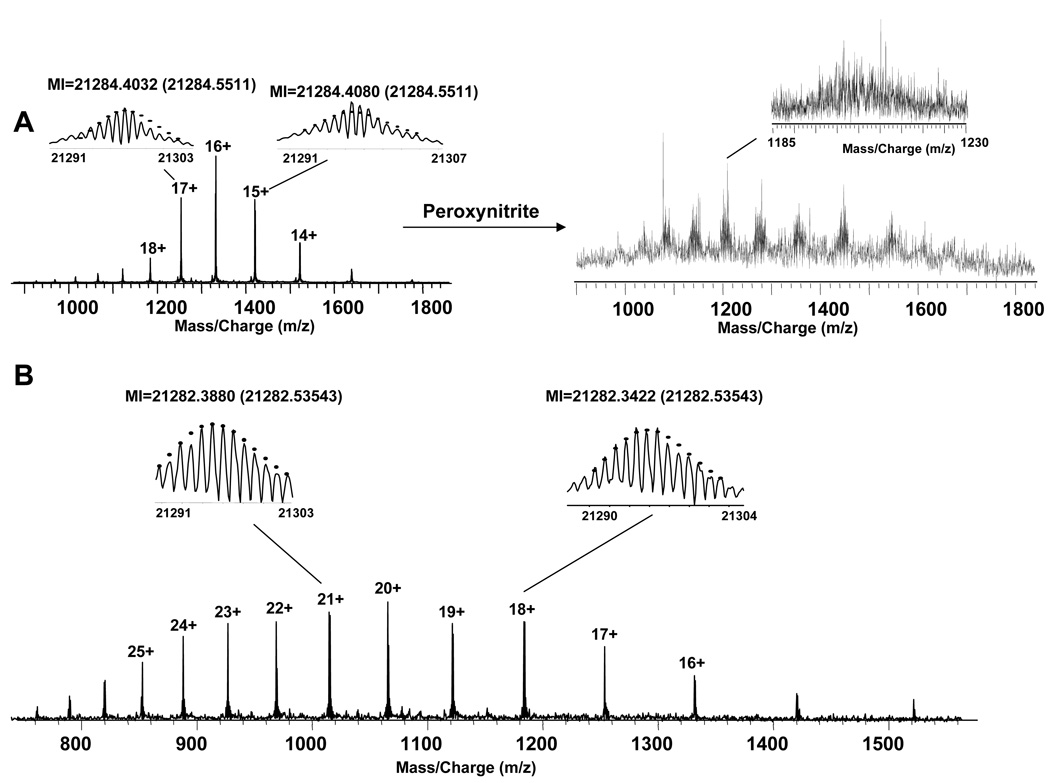
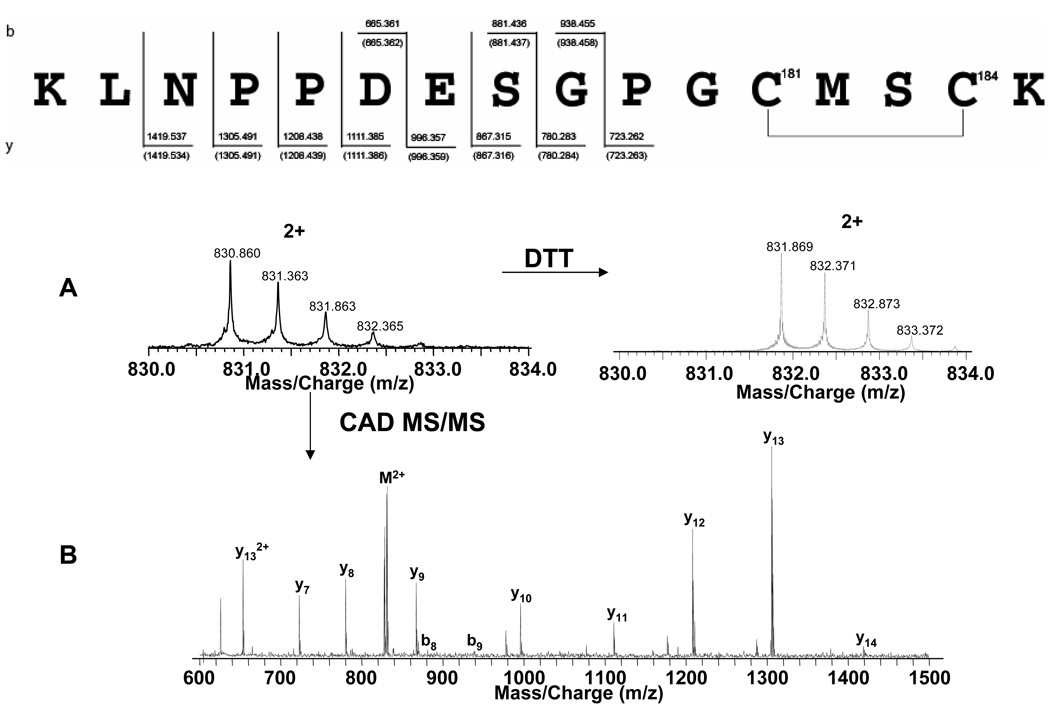
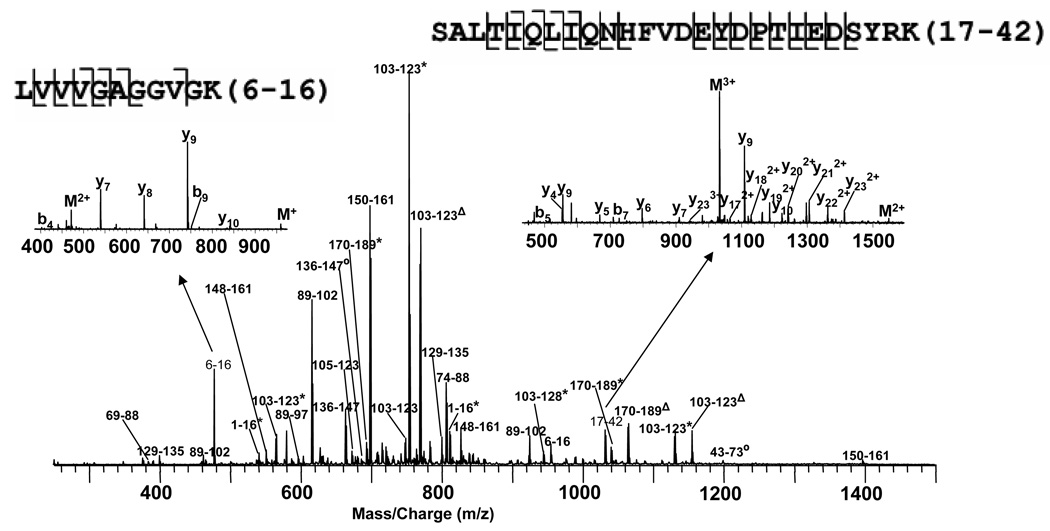
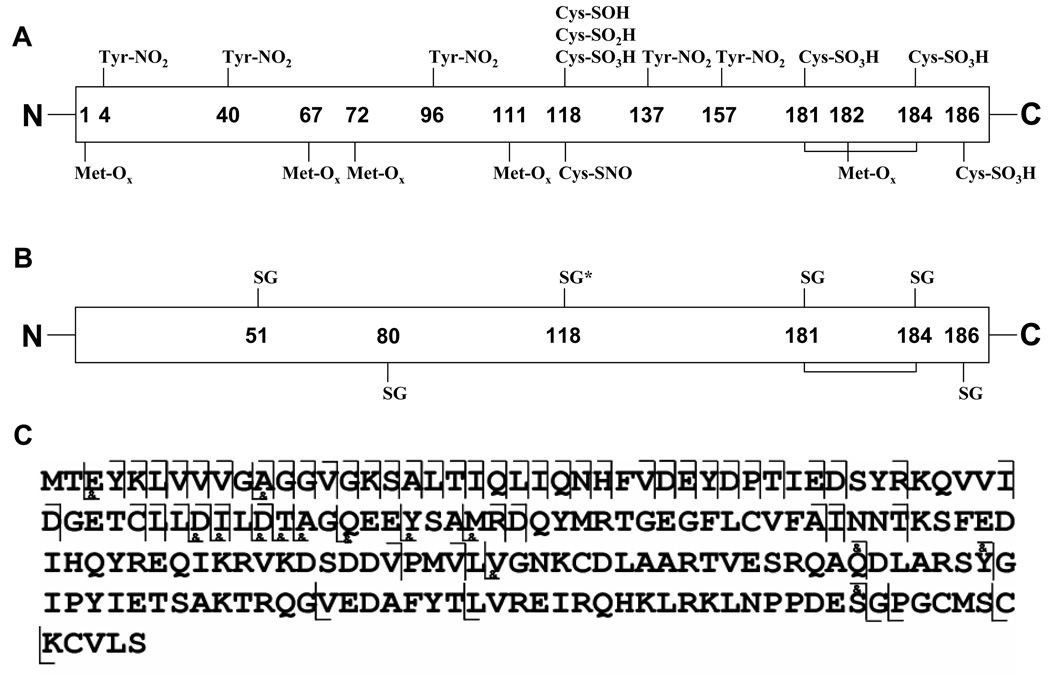
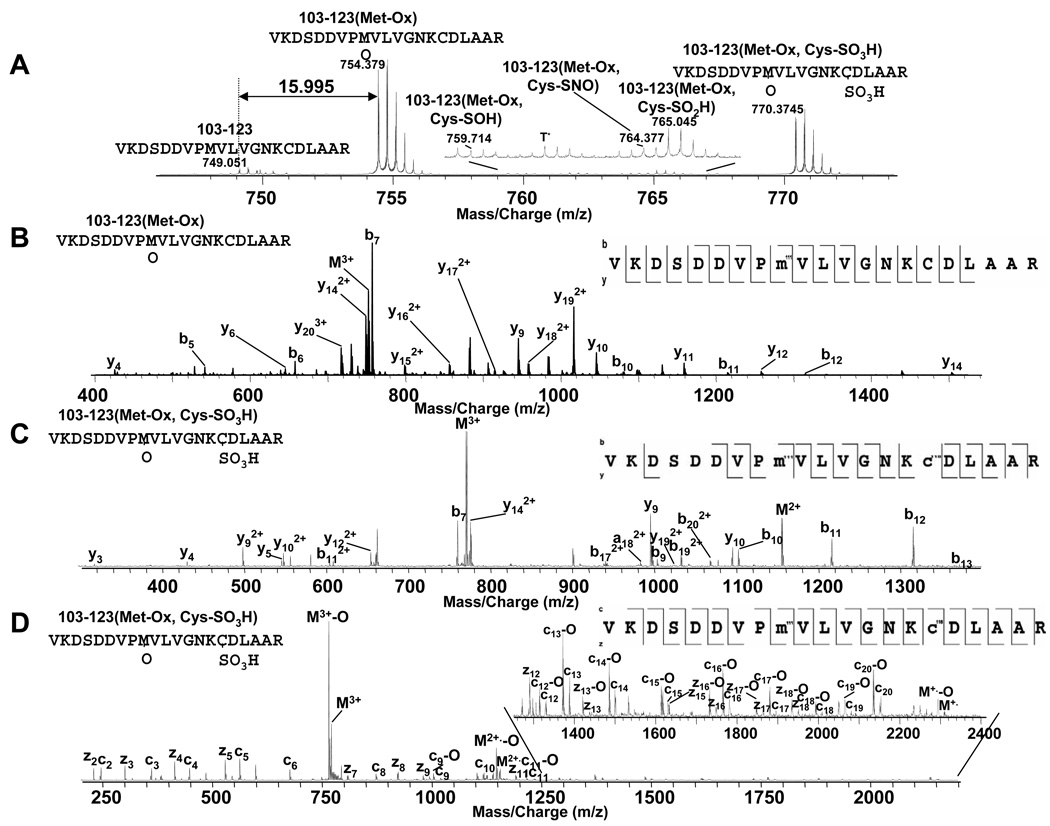
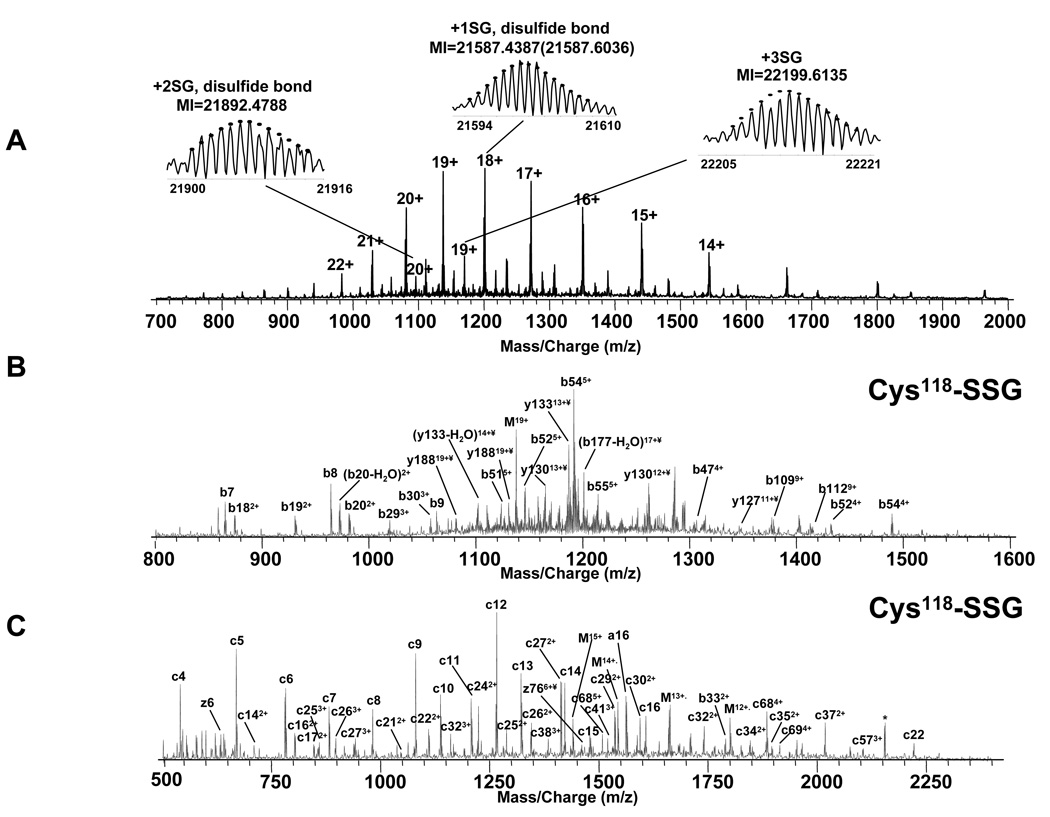
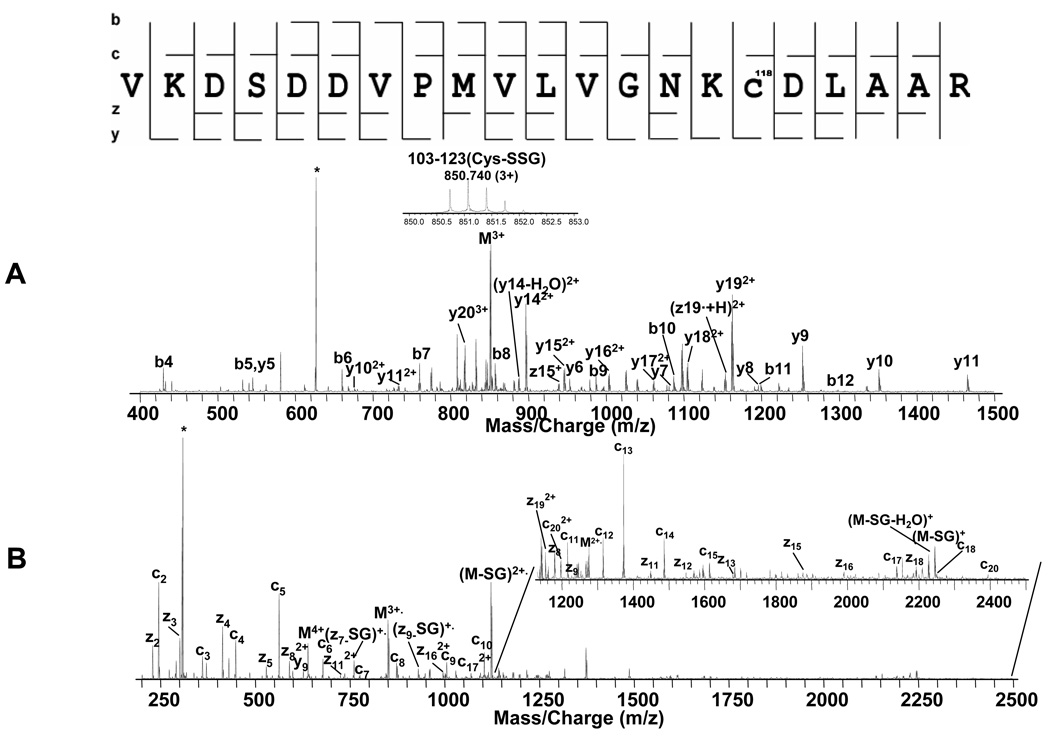
P21ras, the translation product of the most commonly mutated oncogene, is a small guanine nucleotide exchange protein. Oxidant-induced post-translational modifications of p21ras including S-nitrosation and S-glutathiolation have been demonstrated to modulate its activity. Structural characterization of this protein is critical to further understanding of the biological functions of p21ras. In this study, high-resolution and high mass accuracy Fourier transform mass spectrometry was utilized to map, in detail, the post-translational modifications of p21ras (H-ras) exposed to oxidants by combining bottom-up and top-down techniques. For peroxynitrite-treated p21ras, five oxidized methionines, five nitrated tyrosines, and at least two oxidized cysteines (including C118) were identified by "bottom-up" analysis, and the major oxidative modification of C118, Cys118-SO3H, was confirmed by several tandem mass spectrometry experiments. Additionally, "top-down" analysis was conducted on p21ras S-glutathiolated by oxidized glutathione and identified C118 as the major site of glutathiolation among the four surface cysteines. The present study provides a paradigm for an effective and efficient method not only for mapping post-translational modifications of proteins but also for predicting the relative selectivity and specificity of oxidative post-translational modifications, especially using top-down analysis.
Figures
Similar articles
-
Quantification of oxidative posttranslational modifications of cysteine thiols of p21ras associated with redox modulation of activity using isotope-coded affinity tags and mass spectrometry.Free Radic Biol Med. 2007 Mar 15;42(6):823-9. doi: 10.1016/j.freeradbiomed.2006.12.012. Epub 2006 Dec 16. Free Radic Biol Med. 2007. PMID: 17320764 Free PMC article.
-
S-glutathiolation by peroxynitrite of p21ras at cysteine-118 mediates its direct activation and downstream signaling in endothelial cells.FASEB J. 2006 Mar;20(3):518-20. doi: 10.1096/fj.05-4875fje. Epub 2006 Jan 13. FASEB J. 2006. PMID: 16415107
-
S-glutathiolation of p21ras by peroxynitrite mediates endothelial insulin resistance caused by oxidized low-density lipoprotein.Arterioscler Thromb Vasc Biol. 2006 Nov;26(11):2454-61. doi: 10.1161/01.ATV.0000242791.28953.4c. Epub 2006 Aug 24. Arterioscler Thromb Vasc Biol. 2006. PMID: 16931794
-
Regulation of p21ras activity.Trends Genet. 1991 Nov-Dec;7(11-12):346-51. doi: 10.1016/0168-9525(91)90253-m. Trends Genet. 1991. PMID: 1820685 Review.
-
Tyrosine-Nitrated Proteins: Proteomic and Bioanalytical Aspects.Antioxid Redox Signal. 2017 Mar 1;26(7):313-328. doi: 10.1089/ars.2016.6787. Epub 2016 Jul 22. Antioxid Redox Signal. 2017. PMID: 27324931 Free PMC article. Review.
Cited by
-
Multiple proteases to localize oxidation sites.PLoS One. 2015 Mar 16;10(3):e0116606. doi: 10.1371/journal.pone.0116606. eCollection 2015. PLoS One. 2015. PMID: 25775238 Free PMC article.
-
The emerging paradigm of network medicine in the study of human disease.Circ Res. 2012 Jul 20;111(3):359-74. doi: 10.1161/CIRCRESAHA.111.258541. Circ Res. 2012. PMID: 22821909 Free PMC article. Review.
-
Probing the gas-phase folding kinetics of peptide ions by IR activated DR-ECD.J Am Soc Mass Spectrom. 2008 Jun;19(6):780-9. doi: 10.1016/j.jasms.2008.01.001. Epub 2008 Jan 25. J Am Soc Mass Spectrom. 2008. PMID: 18400512 Free PMC article.
-
Endothelial Cell Redox Regulation of Ischemic Angiogenesis.J Cardiovasc Pharmacol. 2016 Jun;67(6):458-64. doi: 10.1097/FJC.0000000000000381. J Cardiovasc Pharmacol. 2016. PMID: 26927696 Free PMC article. Review.
-
Autocatalytic nitration of prostaglandin endoperoxide synthase-2 by nitrite inhibits prostanoid formation in rat alveolar macrophages.Antioxid Redox Signal. 2012 Nov 15;17(10):1393-406. doi: 10.1089/ars.2011.4485. Epub 2012 Jun 25. Antioxid Redox Signal. 2012. PMID: 22578329 Free PMC article.
References
-
- Campbell SL, Khosravi-Far R, Rossman KL, Clark GJ, Der CJ. Increasing complexity of Ras signaling. Oncogene. 1998;17:1395–1413. - PubMed
-
- Bos JL. Ras Oncogenes in Human Cancer - a Review. Cancer Res. 1989;49:4682–4689. - PubMed
-
- Shields JM, Pruitt K, McFall A, Shaub A, Der CJ. Understanding Ras: 'it ain't over 'til it's over'. Trends in Cell Biol. 2000;10:147–154. - PubMed
-
- Boriack-Sjodin PA, Margarit SM, Bar-Sagi D, Kuriyan J. The structural basis of the activation of Ras by Sos. Nature. 1998;394:337–343. - PubMed
-
- Vetter IR, Wittinghofer A. Signal transduction - The guanine nucleotide-binding switch in three dimensions. Science. 2001;294:1299–1304. - PubMed
Publication types
MeSH terms
Substances
Grants and funding
LinkOut - more resources
Full Text Sources
Research Materials
Miscellaneous
