

Active cytosine demethylation triggered by a nuclear receptor involves DNA strand breaks
- PMID: 16840560
- PMCID: PMC1544051
- DOI: 10.1073/pnas.0601793103
Active cytosine demethylation triggered by a nuclear receptor involves DNA strand breaks
Abstract
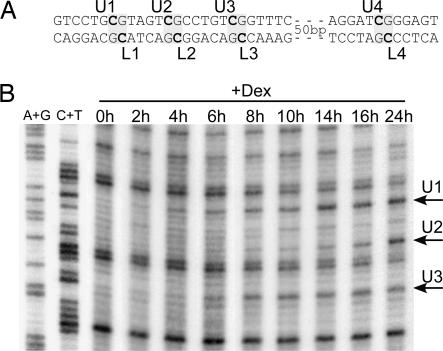
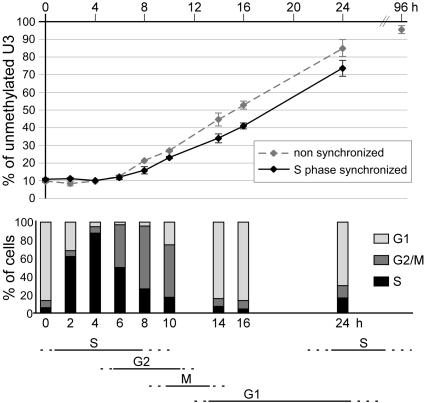
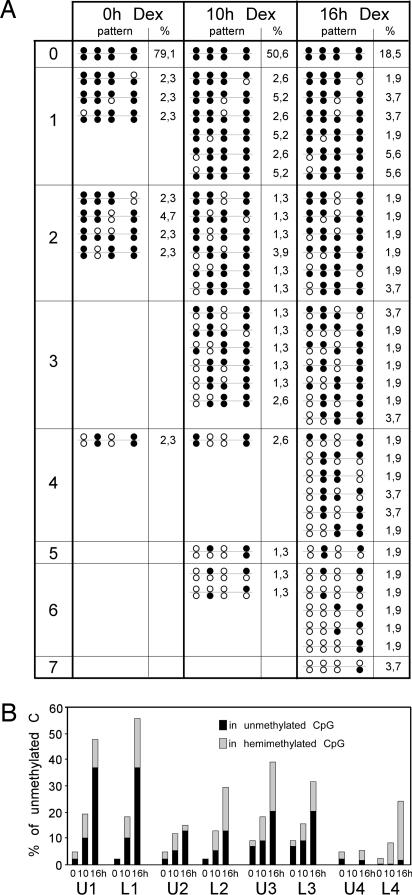
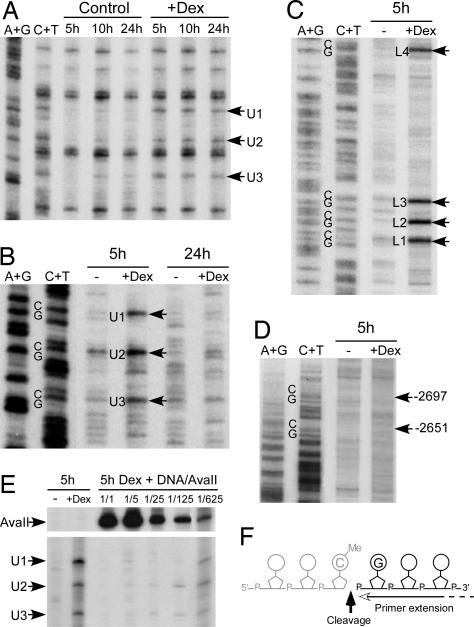
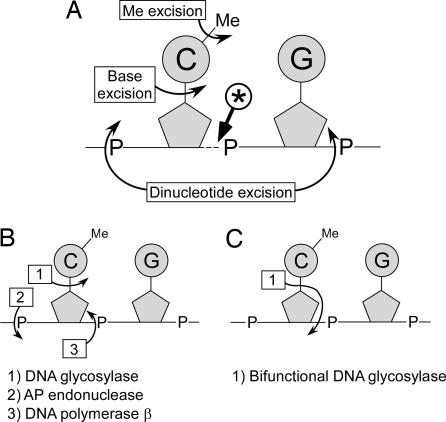
Cytosine methylation at CpG dinucleotides contributes to the epigenetic maintenance of gene silencing. Dynamic reprogramming of DNA methylation patterns is believed to play a key role during development and differentiation in vertebrates. The mechanisms of DNA demethylation remain unclear and controversial. Here, we present a detailed characterization of the demethylation of an endogenous gene in cultured cells. This demethylation is triggered in a regulatory region by a transcriptional activator, the glucocorticoid receptor. We show that DNA demethylation is an active process, occurring independently of DNA replication, and in a distributive manner without concerted demethylation of cytosines on both strands. We demonstrate that the DNA backbone is cleaved 3' to the methyl cytidine during demethylation, and we suggest that a DNA repair pathway may therefore be involved in this demethylation.
Figures
Similar articles
-
Hairpin-bisulfite PCR: assessing epigenetic methylation patterns on complementary strands of individual DNA molecules.Proc Natl Acad Sci U S A. 2004 Jan 6;101(1):204-9. doi: 10.1073/pnas.2536758100. Epub 2003 Dec 12. Proc Natl Acad Sci U S A. 2004. PMID: 14673087 Free PMC article.
-
Local DNA demethylation in vertebrates: how could it be performed and targeted?FEBS Lett. 2001 Apr 13;494(3):135-40. doi: 10.1016/s0014-5793(01)02328-6. FEBS Lett. 2001. PMID: 11311228 Review.
-
A replication-dependent passive mechanism modulates DNA demethylation in mouse primordial germ cells.Development. 2013 Jul;140(14):2892-903. doi: 10.1242/dev.093229. Epub 2013 Jun 12. Development. 2013. PMID: 23760957
-
Active Demethylation of Non-CpG Moieties in Animals: A Neglected Research Area.Int J Mol Sci. 2019 Dec 12;20(24):6272. doi: 10.3390/ijms20246272. Int J Mol Sci. 2019. PMID: 31842376 Free PMC article.
-
Active DNA demethylation in post-mitotic neurons: a reason for optimism.Neuropharmacology. 2013 Dec;75:233-45. doi: 10.1016/j.neuropharm.2013.07.036. Epub 2013 Aug 16. Neuropharmacology. 2013. PMID: 23958448 Free PMC article. Review.
Cited by
-
Gene-Stress-Epigenetic Regulation of FKBP5: Clinical and Translational Implications.Neuropsychopharmacology. 2016 Jan;41(1):261-74. doi: 10.1038/npp.2015.235. Epub 2015 Aug 13. Neuropsychopharmacology. 2016. PMID: 26250598 Free PMC article. Review.
-
Mammalian DNA demethylation: multiple faces and upstream regulation.Epigenetics. 2013 Jul;8(7):679-84. doi: 10.4161/epi.24977. Epub 2013 May 17. Epigenetics. 2013. PMID: 23803967 Free PMC article.
-
Introduction--Epiphanies in epigenetics.Prog Mol Biol Transl Sci. 2011;101:1-21. doi: 10.1016/B978-0-12-387685-0.00001-9. Prog Mol Biol Transl Sci. 2011. PMID: 21507348 Free PMC article.
-
Mechanisms of peroxisome proliferator-induced DNA hypomethylation in rat liver.Mutat Res. 2008 Sep 26;644(1-2):17-23. doi: 10.1016/j.mrfmmm.2008.06.009. Epub 2008 Jul 1. Mutat Res. 2008. PMID: 18639561 Free PMC article.
-
Betamethasone administration during pregnancy is associated with placental epigenetic changes with implications for inflammation.Clin Epigenetics. 2021 Aug 26;13(1):165. doi: 10.1186/s13148-021-01153-y. Clin Epigenetics. 2021. PMID: 34446099 Free PMC article.
References
Publication types
MeSH terms
Substances
LinkOut - more resources
Full Text Sources
Other Literature Sources
