. 2006 Aug;80(15):7295-307.
doi: 10.1128/JVI.00679-06.

Independent contributions of polyomavirus middle T and small T to the regulation of early and late gene expression and DNA replication

Affiliations

Independent contributions of polyomavirus middle T and small T to the regulation of early and late gene expression and DNA replication

Li Chen et al. J Virol. 2006 Aug.

Abstract

We previously showed that murine polyomavirus mutants that lack both middle T (MT) and small T (ST) functions have a severe pleiotropic defect in early and late viral gene expression as well as genome amplification. The respective contribution of MT and ST to this phenotype was unclear. This work separates the roles of MT and ST in both permissive mouse cells and nonpermissive rat cells. It demonstrates for the first time a role for both proteins. To gain insight into the signaling pathways that might be required, we focused on MT and its mutants. The results show that each of the major MT signaling connections, Shc, phosphatidylinositol 3'-kinase, and phospholipase C gamma1, could contribute in an additive way. Unexpectedly, a mutant lacking all these connections because the three major tyrosines had been converted to phenylalanine retained some activity. A mutant in which all six MT C-terminal tyrosines had been mutated was inactive. This suggests a novel signaling pathway for MT that uses the minor tyrosines. What is common to ST and the individual MT signaling pathways is the ability to signal to the polyomavirus enhancer, in particular to the crucial AP-1 and PEA3/ets binding sites. This connection explains the pleiotropy of MT and ST effects on transcription and DNA replication.


Figures

FIG. 1.
FIG. 1.
Functional map of MT and ST. A linear map of the 421- and 195-amino-acid MT and ST proteins is shown. The landmarks shown are the positions of the MT and ST splice sites; the J-domain and the PP2A and src binding domains; the carboxy-terminal hydrophobic membrane insertion domain; the pS257 binding site for 14-3-3 protein; the positions of the three major tyrosines (underlined), Y250, Y315, and Y322, and their connections to downstream signaling intermediates; and the positions of the three minor tyrosines (dashed underline), Y258, Y288, and Y297.
FIG. 2.
FIG. 2.
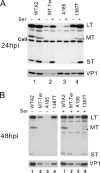
Gene expression patterns of viral strains with MT null and/or ST null mutations. NIH 3T3 cells were infected with equal doses of the wild type and mutants as indicated above the lanes. Doses of input virus genomes were verified by Southern blotting analysis (see Fig. 7, below). Infection and Western blotting conditions are described in Materials and Methods. Infected cells were cultivated in medium containing 0.5% (−ser) or 10% serum (+ser). Protein samples were collected at 24 hpi (A) or 48 hpi (B). The exposure of the blot with the 48-hpi samples was shorter than that for the 24-hpi blot. The positions of LT, MT(*), and ST are indicated on the right. Note the overlap in migration of the MT-Ter and ST proteins and the smaller size of 1387T MT. The antibody used cross-reacts with some cell proteins (Cell bands). The intensity of these cellular bands serves as a loading control. The lighter exposure at 48 hpi failed to reveal the cellular band. The membranes were stripped and reprobed with an antibody for the late capsid protein (VP1). Different arrangements of the samples were chosen to display the 24- and 48-hpi samples. (A) Alternating the results for samples with and without serum highlights the effect of serum factors on viral gene expression. (B) The display of all samples under the same serum treatment condition highlights strain-specific differences in viral gene expression.
FIG. 3.
FIG. 3.
Complementation between MT retroviral vectors and the MTnull/STnull A185 mutant virus. NIH 3T3 cells were infected as described in Materials and Methods with retrovirus vectors expressing wild-type or mutant MT or vector control as shown above the lanes (see Table 1 for the mutant naming code). (A and B) Anti-PYV early protein antibody. Cross-reacting cellular bands are marked, as are the LT and MT positions. Results are from 26 h post-retrovirus infection, 6 h post-PYV infection, prior to synthesis of PYV LT (A) or 48 h post-PYV infection (B). (C) Results of blotting with anti-VP1 antibody at 48 hpi.
FIG. 4.
FIG. 4.
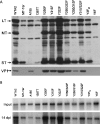
Gene expression patterns of viral strains with MT tyrosine mutations. See the legend for Fig. 2 for further information. Lanes 1 to 4 were also shown in Fig. 2. Doses of input virus genomes were verified by Southern blotting analysis (see Fig. 7, below). The exposure of the blot with the 48-hpi samples was shorter than that for the 24-hpi blot. Different arrangements of the samples were chosen to display the 24- and 48-hpi samples. In panel A, alternating the results for samples with and without serum highlights the serum effect on MT migration.
FIG. 5.
FIG. 5.
“Immediate-early” gene expression pattern of mutants prior to MT and ST protein expression in the presence or absence of serum factors. Cells were infected with wild-type, MT-Ter, Y6F, and A185 strains as described in the legend to Fig. 2. Early proteins produced during the early phase of the infections are shown. Given the low levels of viral proteins at these early times, a long exposure time was required, increasing the intensity of the cross-reacting cellular bands. The LT, MT, and ST bands are marked (*). Results after reprobing the same gel for the late proteins (VP1) are shown.
FIG. 6.
FIG. 6.
Transcription patterns. Cells were infected in 0.5% serum with wild-type, MT-Ter, Y6F, and A185 strains as described in the legend to Fig. 5. Samples were taken at the times shown (16 to 24 hpi). Total RNA was extracted and electrophoresed as described in Materials and Methods. The ethidium bromide staining of the gels indicates equivalent loading of 28S and 18S rRNAs in sharp bands and the absence of degradation (not shown). However, the presence of rRNAs results in bulging distortions. The blots were hybridized with digoxigenin-substituted strand-specific RNA probes. (A) The early transcript-specific probe (nt 399 to 1101) detects all early RNAs. (B) The late transcript-specific probe (nt 3918 to 2928) detects all late RNAs. Early transcripts are displayed by sampling time, while late transcripts are displayed by virus strain. The positions of MT and ST (**) and LT (*) transcripts are shown at 18 and 21 hpi. From 21 hpi (wild type) or 24 hpi (mutants), giant late RNAs migrating above the 28S RNA were seen (arrow). The early blot was cut close to the 28S band.
FIG. 7.
FIG. 7.
Genome amplification patterns of mutant viruses. NIH 3T3 cells were infected under the conditions described in the legend to Fig. 4. Input samples were harvested at 4 hpi, and experimental time points were simultaneous to times for protein samples shown in Fig. 4, namely, at 24 (data not shown) and 48 hpi. DNA extraction (total DNA) and Southern blot analysis are described in Materials and Methods. Visualization of ethidium bromide-stained total DNA was provided a control for equal loading. All blots were hybridized with the same probe. The quantitation of these blots is given in Table 2.
FIG. 8.
FIG. 8.
Effects of retroviral MT complementation on the replication of the A185 MTnull/STnull mutant. Retroviral wild-type and mutant MT were coinfected with PYV A185 as described in the legend for Fig. 3. DNA samples were harvested from the same experiment at 48 hpi and analyzed by Southern blotting as described for Fig. 7. Duplicate samples are shown. The bar graph shows the total amplification calculated as the output/input ratio for each retroviral coinfection, with error bars. The relative amplification between coinfection with the empty vector control and the various wild-type and mutant MTs is given on the top of each bar.
FIG. 9.
FIG. 9.
Gene expression and genome maintenance in semipermissive Fischer rat FR3T3 cells. FR3T3 cells were infected as described in the legend of Fig. 2 with the viral strains indicated on top of the lanes. Infected cells were cultivated in medium supplemented with 5% serum. Protein (A) and DNA (B) samples were collected at 14 dpi and processed as described in the legends for Fig. 2 and 7, respectively. Output DNA samples were diluted twofold compared to input samples.

Similar articles

Cited by

References

    1. Acheson, N. H. 1978. Polyoma virus giant RNAs contain tandem repeats of the nucleotide sequence of the entire viral genome. Proc. Natl. Acad. Sci. USA 68:4754-4758. - PMC - PubMed
    1. Benjamin, T. L. 1970. Host range mutants of polyoma virus. Proc. Natl. Acad. Sci. USA 67:394-399. - PMC - PubMed
    1. Berger, H., and E. Wintersberger. 1986. Polyomavirus small T antigen enhances replication of viral genomes in 3T6 mouse fibroblasts. J. Virol. 60:768-770. - PMC - PubMed
    1. Besser, D., M. Urich, M. Sakaue, A. Messerschmitt, K. Ballmer-Hofer, and Y. Nagamine. 1995. Urokinase-type plasminogen activator gene regulation by polyomavirus middle-T antigen. Oncogene 11:2383-2391. - PubMed
    1. Cahill, K. B., A. J. Roome, and G. C. Carmichael. 1990. Replication-dependent transactivation of the polyomavirus late promoter. J. Virol. 64:992-1101. - PMC - PubMed

Publication types

Substances

LinkOut - more resources