. 2006 Jul;80(14):7146-58.
doi: 10.1128/JVI.02745-05.

CD1d mediates T-cell-dependent resistance to secondary infection with encephalomyocarditis virus (EMCV) in vitro and immune response to EMCV infection in vivo

Affiliations

CD1d mediates T-cell-dependent resistance to secondary infection with encephalomyocarditis virus (EMCV) in vitro and immune response to EMCV infection in vivo

Petr O Ilyinskii et al. J Virol. 2006 Jul.

Abstract

The innate and adaptive immune responses have evolved distinct strategies for controlling different viral pathogens. Encephalomyocarditis virus (EMCV) is a picornavirus that can cause paralysis, diabetes, and myocarditis within days of infection. The optimal innate immune response against EMCV in vivo requires CD1d. Interaction of antigen-presenting cell CD1d with distinct natural killer T-cell ("NKT") populations can induce rapid gamma interferon (IFN-gamma) production and NK-cell activation. The T-cell response of CD1d-deficient mice (lacking all NKT cells) against acute EMCV infection was further studied in vitro and in vivo. EMCV persisted at higher levels in CD1d-knockout (KO) splenocyte cultures infected in vitro. Furthermore, optimal resistance to repeat cycles of EMCV infection in vitro was also shown to depend on CD1d. However, this was not reflected in the relative levels of NK-cell activation but rather by the responses of both CD4(+) and CD8(+) T-cell populations. Repeated EMCV infection in vitro induced less IFN-gamma and alpha interferon (IFN-alpha) from CD1d-deficient splenocytes than with the wild type. Furthermore, the level of EMCV replication in wild-type splenocytes was markedly and specifically increased by addition of blocking anti-CD1d antibody. Depletion experiments demonstrated that dendritic cells contributed less than the combination of NK and NKT cells to anti-EMCV responses and that none of these cell types was the main source of IFN-alpha. Finally, EMCV infection in vivo produced higher levels of viremia in CD1d-KO mice than in wild-type animals, coupled with significantly less lymphocyte activation and IFN-alpha production. These results point to the existence of a previously unrecognized mechanism of rapid CD1d-dependent stimulation of the antiviral adaptive cellular immune response.


Figures

FIG. 1.
FIG. 1.
Primary EMCV infection of wild-type and CD1d-KO mouse splenocytes. (A) EMCV replication in vitro. Freshly isolated splenocytes from wild-type and CD1d-KO C57BL/6 mice were infected by EMCV using a MOI infectious units/splenocyte) of 1.0 or 3.0. Virus titers were determined as described in Materials and Methods. Data shown are from cultures of individual representative animals. (B) IFN-γ production in vitro. Splenocytes from wild-type C57BL/6 mice were infected with different EMCV doses or stimulated with α-galactosylceramide (100 ng/ml), poly(I:C), or LPS (both 5 μg/ml). Mean IFN-γ production was determined by enzyme-linked immunosorbent assay. *, P < 0.05; **, P < 0.01. (C) Activation of NK, T, and B cells after EMCV infection as measured by CD69 expression. Sample FACS profiles from individual representative animals are shown. FACS was performed on the day after infection by EMCV using a MOI of 1.0. Absolute percentages of inactive and activated (CD69+) NK1.1+, CD3+, and CD19+ cells within the viable leukocyte gate are shown. Quadrant gates were based on isotype staining.
FIG. 2.
FIG. 2.
EMCV reinfection of wild-type and CD1d-KO mouse splenocytes. (A) EMCV replication in vitro: reinfection. Splenocytes from wild-type and CD1d-KO C57BL/6 mice were infected by EMCV using a MOI of 1.0 and reinfected with the same dose at day 5 after initial infection. (B) IFN-γ production after EMCV reinfection. Cytokine levels immediately before reinfection by EMCV (MOI = 1.0) and 48 h after are shown. Results from splenocyte cultures from representative individual mice (wild-type or CD1d-KO) are shown. (C) Levels of activation of NK, T, and B cells after EMCV reinfection. Splenocyte cultures from wild-type and CD1d-KO mice infected with EMCV at inception were reinfected with 1 MOI of EMCV at day 5. Sample FACS profiles and absolute percentages of inactive and activated (CD69+) NK1.1+ CD3 NK cells, CD3+ T cells, CD3+ CD8+ double-positive CD8 T cells, and CD19+ B cells are shown. (D) Activation of leukocytes after EMCV reinfection. Mean percentages (± SD) of activated cells for each subtype 24 h after reinfection are shown. *, P < 0.05.
FIG. 3.
FIG. 3.
Levels of activation of NK, T, and B cells after EMCV infection of wild-type mouse splenocytes in the presence of L929 cells. Cells were infected with EMCV (MOI = 1.0). Sample FACS profiles and absolute percentages of inactive and activated (CD69+) NK1.1+ CD3 NK cells, CD3+ T cells, and CD19+ B cells are shown 24 h after infection. Mock-infected samples are shown in panels on the far left and far right; virus-infected samples are shown in the inner panels for easy comparison.
FIG. 4.
FIG. 4.
Primary EMCV infection of wild-type and CD1d-KO mouse splenocytes coincubated with L929 cells. (A) EMCV replication in vitro. Wild-type and CD1d-KO splenocyte/L929 cocultures were infected with EMCV (MOI = 1.0). Data for four independent cultures are shown. (B) Levels of activation of T and B cells after primary EMCV infection in vitro. Sample FACS profiles and absolute percentages of inactive and activated (CD69+) NK1.1+ CD3 NK cells, CD3+ T cells, and CD19+ B cells are shown 48 h after infection. (C) Activation of T and B cells after EMCV infection in vitro. Mean percentages (± SD) of activated B and T cells 48 h after infection are shown. *, P < 0.05.
FIG. 5.
FIG. 5.
EMCV reinfection of wild-type and CD1d-KO mouse splenocytes coincubated with L929 cells. (A) Levels of activation of CD8+ T cells after EMCV reinfection. Sample FACS profiles and absolute percentages of inactive and activated (CD69+) CD8+ T cells are shown 24 h after reinfection with EMCV (MOI = 1.0). (B) Activation of CD8+ T cells after EMCV reinfection. Mean percentages (± SD) of activated cells 24 h after reinfection are shown. *, P < 0.05. (C) IFN-γ production after EMCV reinfection. Cocultures were infected with 1 MOI per splenocyte. Reinfection was done on day 7. Results from splenocyte/L929 cultures from representative individual mice (wild-type or CD1d-KO) are shown. (D) IFN-α production after EMCV infection and reinfection. Cocultures were infected as described and IFN-α level measured after initial infection and reinfection. Background IFN-α levels from uninfected cultures set up in parallel are subtracted.
FIG. 6.
FIG. 6.
EMCV replication in wild-type and CD1d-KO mouse splenocytes coincubated with L929 cells in the presence of anti-CD1d antibody. Splenocyte/L929 cocultures were twice (days 0 and 5) infected with EMCV (MOI = 1.0) and treated with soluble anti-CD1d/isotype MAbs either concurrently with initial infection (A) or with reinfection (B).
FIG. 7.
FIG. 7.
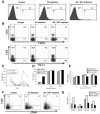
EMCV reinfection of immune cell-depleted splenocytes cocultured with L929 cells. Splenocytes were depleted with anti-DC MAb CD11c and 33D1 (61) or anti-NK/NKT-cell MAb (NK1.1 and Ly49b) by high-speed FACS (MoFlo). Splenocyte/L929 cocultures were infected with EMCV (MOI = 1.0) on days 0 and 5. (A) Splenocyte immune cell depletion. Splenocytes were stained with MAb to DC or NK/NKT, and negative cells (gate “R2”) were collected from high-speed FACS sorting with the percentage shown. (B) Levels of splenocyte immune cell subsets following depletion and EMCV infection. Representative FACS profiles of splenocyte immune cell subsets following depletions and EMCV infection. Upper panels: stained for CD4 and DC. Lower panels: stained for NK, NKT, and T cells. Cultures were infected with EMCV for 48 h. (C) EMCV replication in immune cell-depleted splenocytes. Viral titers shown are from individual representative cultures. (D) IFN-γ production after EMCV reinfection of immune cell-depleted splenocytes. Results of individual representative cultures from same experiment as that shown in panel A. (E) IFN-α production after EMCV reinfection of immune cell-depleted splenocytes. Results of individual representative cultures from same experiment as that shown in panel A. Background IFN-α levels from uninfected cultures were subtracted. (F) Levels of activation of CD8+ T cells after EMCV reinfection of immune cell-depleted splenocytes. Sample FACS profiles and absolute percentages of inactive and activated (CD69+) CD8+ T cells are shown at peak (48 h) after reinfection with EMCV from the same experiment as that shown in panel A. (G) Activation of CD4+ and CD8+ T cells after EMCV reinfection of immune cell-depleted splenocytes. Percentages of activated T cells within CD4+ and CD8+ subsets 24 and 48 h after reinfection from same experiment as that shown in panel A are shown.
FIG. 8.
FIG. 8.
EMCV infection of wild-type and CD1d-KO mice in vivo. (A) EMCV replication in vivo. Animal sera drawn from wild-type and CD1d-KO C57BL/6 mice after 48 h of EMCV infection were used to determine viral titers. Data shown are from sera of each experimental group, which consisted of three wild-type (WT1 to WT3) and three CD1d-KO (CD1d-KO1 to CD1d-KO3) 4-week-old animals. (B) Levels of activation of CD8+ T cells after EMCV infection in vivo. FACS profiles and absolute percentages of inactive and activated (CD69+) CD8+ T cells are shown 48 h after infection with EMCV in vivo. Data are from the same animals as in panel A. (C) Activation of CD8+ T cells after EMCV infection in vivo. Percentages of activated cells 48 h after infection in vivo are shown. Data are from the same animals as in panel A.
FIG. 9.
FIG. 9.
Lymphocyte activation following EMCV infection of wild-type and CD1d-KO mice in vivo. (A) Levels of activation of T and B cells after EMCV infection in vivo. Sample FACS profiles and absolute percentages of inactive and activated (CD69+) CD4+ T cells and CD19+ B cells are shown 48 h after viral infection. Uninfected freshly isolated wild-type splenocytes are used as a control. (B) Activation of CD8+ and CD4+ T cells after EMCV infection in vivo. Percentages of activated cells 48 h after infection are shown. Data are summarized from several separate experimental groups for each data point. **, P < 0.01. Data are from the same animals as in panel A. (C) IFN-α production after EMCV infection in vivo. Levels of IFN-α were measured in the sera of experimental animals 48 h after viral infection. Background IFN-α levels from the sera of uninfected cultures assayed in parallel are subtracted. Data are from the same animals as in panel A.

Similar articles

Cited by

References

    1. Ashkar, A. A., and K. L. Rosenthal. 2003. Interleukin-15 and natural killer and NKT cells play a critical role in innate protection against genital herpes simplex virus type 2 infection. J. Virol. 77:10168-10171. - PMC - PubMed
    1. Baek, H. S., and J. W. Yoon. 1990. Role of macrophages in the pathogenesis of encephalomyocarditis virus-induced diabetes in mice. J. Virol. 64:5708-5715. - PMC - PubMed
    1. Baron, J. L., L. Gardiner, S. Nishimura, K. Shinkai, R. Locksley, and D. Ganem. 2002. Activation of a nonclassical NKT cell subset in a transgenic mouse model of hepatitis B virus infection. Immunity 16:583-594. - PubMed
    1. Behar, S. M., and S. Cardell. 2000. Diverse CD1d-restricted T cells: diverse phenotypes, and diverse functions. Semin. Immunol. 12:551-560. - PubMed
    1. Behar, S. M., T. A. Podrebarac, C. J. Roy, C. R. Wang, and M. B. Brenner. 1999. Diverse TCRs recognize murine CD1. J. Immunol. 162:161-167. - PubMed

Publication types

MeSH terms

LinkOut - more resources