. 2006 Jun 28;26(26):6935-44.
doi: 10.1523/JNEUROSCI.0784-06.2006.

Long-term depression at the mossy fiber-deep cerebellar nucleus synapse

Affiliations

Long-term depression at the mossy fiber-deep cerebellar nucleus synapse

Wei Zhang et al. J Neurosci. .

Abstract

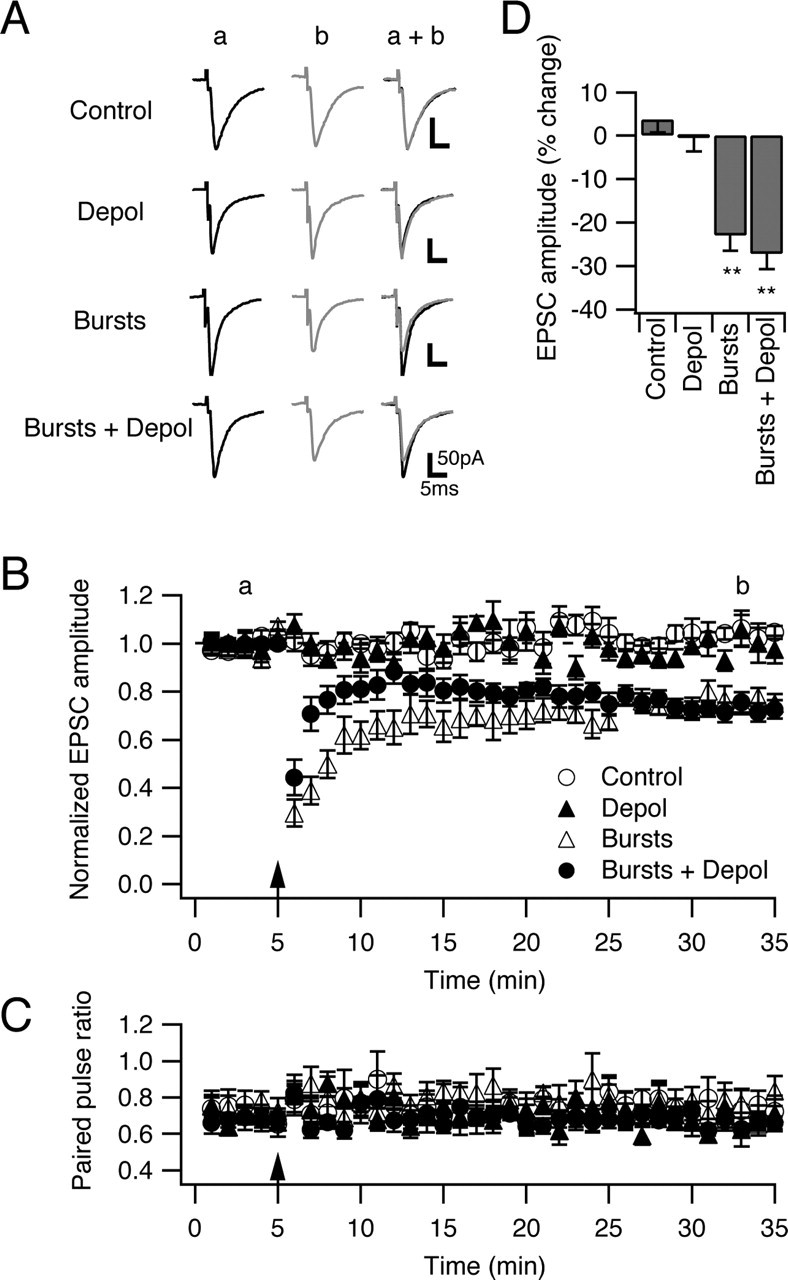
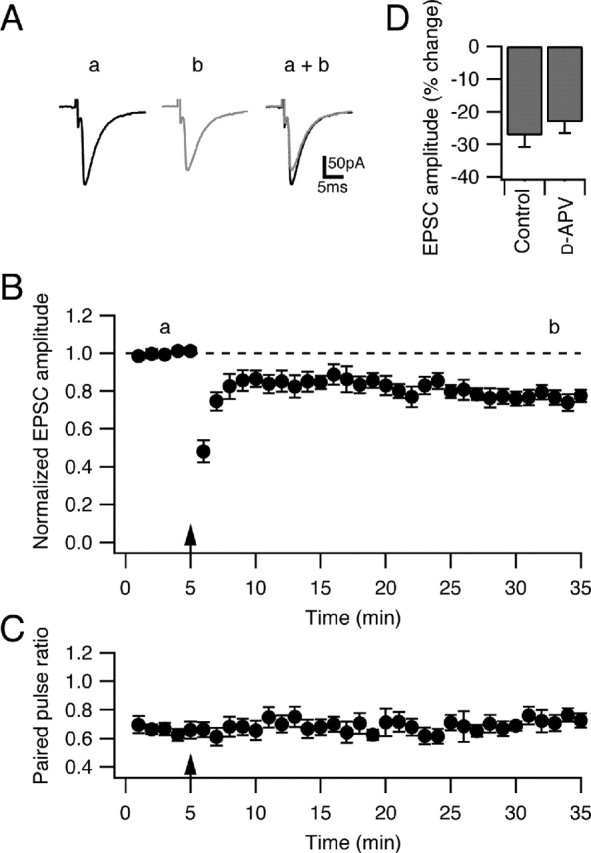
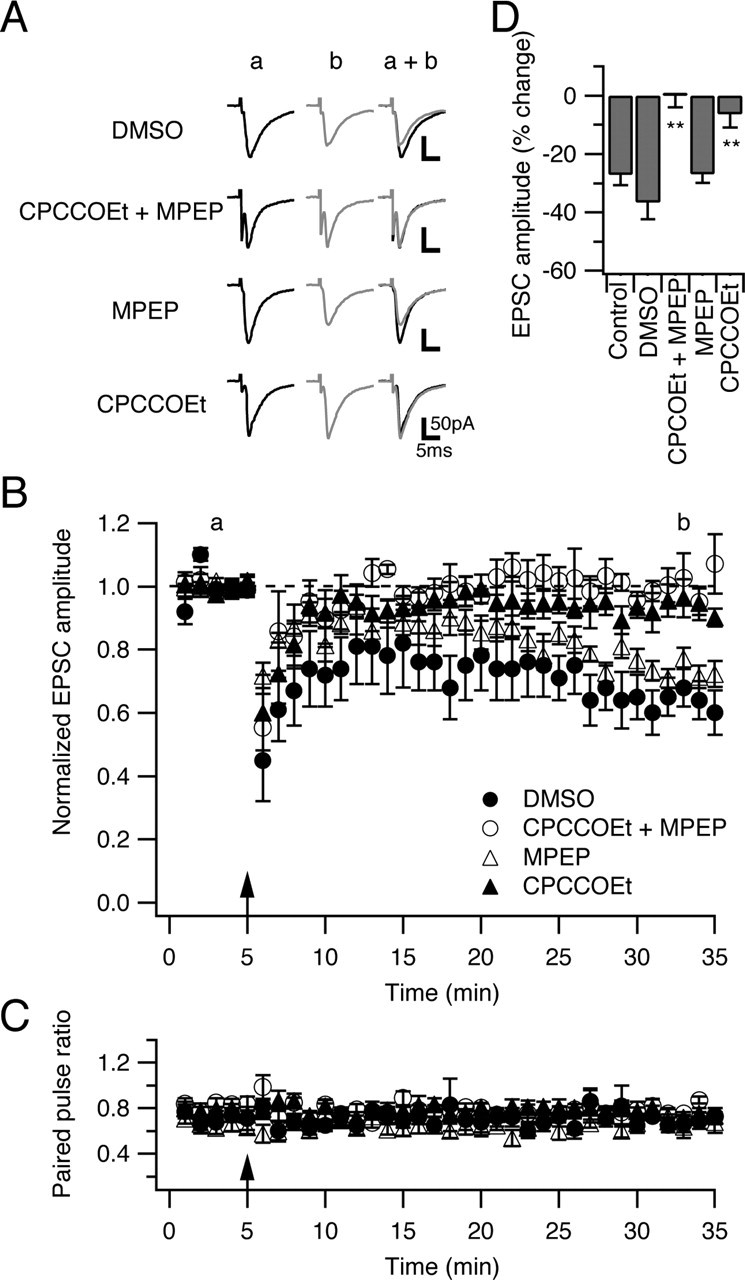
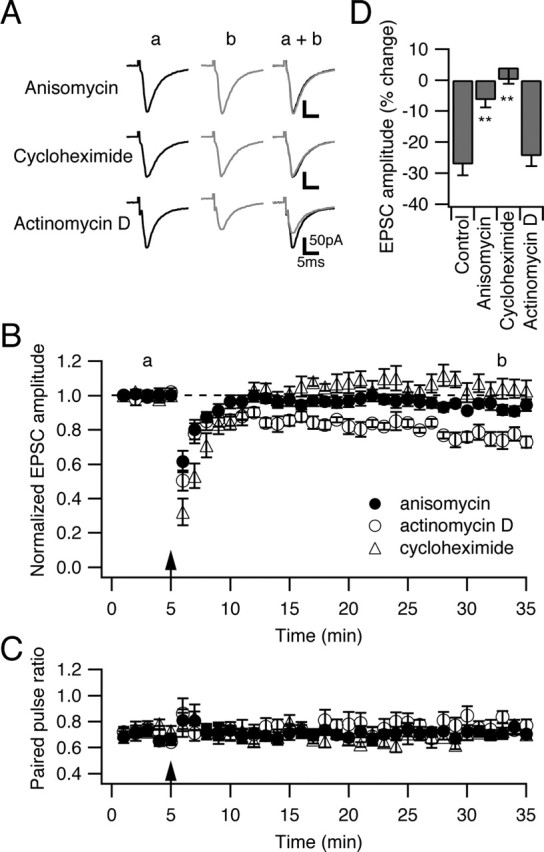
Several lines of evidence have indicated that the deep cerebellar nuclei (DCN) are a site of memory storage for certain forms of motor learning, most notably associative eyelid conditioning. In particular, these experiments, together with network models, have implicated the excitatory glutamatergic synapse between mossy fibers and DCN neurons in this memory trace. However, to date, evidence for persistent use-dependent change in the strength of this synapse has been almost entirely absent. Here, we report that high-frequency burst stimulation of mossy fibers, either alone or paired with postsynaptic depolarization, gives rise to long-term depression (LTD) of the mossy fiber-DCN synapse. This form of LTD is not associated with changes in the paired-pulse ratio and is blocked by loading with a postsynaptic Ca2+ chelator but not by bath application of an NMDA receptor antagonist. Mossy fiber-DCN LTD requires activation of a group I metabotropic glutamate receptor (mGluR) and protein translation. Unlike mGluR/translation-dependent LTD in other brain regions, this form of LTD requires mGluR1 and is mGluR5 independent.


Figures

Figure 1.
Figure 1.
EPSCs evoked by paired and burst stimulation at the mossy fiber–DCN synapse. A, In these recordings, 200 μm picrotoxin, 20 μm SR95531, and 1 μm strychnine were applied to block synaptic inhibition, and a command potential of −70 mV was applied. EPSCs were evoked by a paired-pulse stimulation with a 100 ms interpulse interval in control conditions (black). EPSCs were partially blocked in the presence of 20 μm NBQX (red) and completely blocked in the presence of 50 μm d-APV and 20 μm NBQX (blue). Traces shown are the average of six consecutive responses. B, EPSCs evoked by a stimulus consisting of 10 pulses at 100 Hz have two components: an sEPSC (top black trace) and a series of fEPSCs (bottom black trace). In the presence of 50 μm d-APV, both the sEPSC (top red trace) and the fEPSCs (bottom red trace) were partially blocked. In the presence of 50 μm d-APV and 20 μm NBQX, the fEPSCs were completely blocked (bottom blue trace) but not the sEPSC (top blue trace). dl-TBOA at 50 μm, a glutamate transporter blocker, potentiated the sEPSC (top gray trace). Traces shown are the average of three consecutive responses.
Figure 2.
Figure 2.
The burst-evoked sEPSC requires activation of mGluR1 but not mGluR5. A, An sEPSC was evoked by a high-frequency stimulus consisting of 10 pulses at 100 Hz (black), with inhibitory synaptic transmission blocked by bath-applied 200 μm picrotoxin, 20 μm SR95531, and 1 μm strychnine and fast excitatory synaptic transmission blocked by bath-applied 50 μm d-APV and 5 μm NBQX. The sEPSC was enhanced by 50 μm dl-TBOA (red). In the presence of 50 μm dl-TBOA, the sEPSC was not blocked by 2 μm MPEP (blue) but was nearly completely blocked by additional application of 125 μm CPCCOEt (gray). The sEPSC partially recovered after a 15–20 min washout of CPCCOEt (green). Traces shown are the average of three consecutive responses. B, Summary graph showing the different sensitivity of sEPSC peak and sEPSC charge transfer to MPEP and CPCCOEt (n = 5). All of the data were normalized to the value in the presence of 50 μm dl-TBOA.
Figure 3.
Figure 3.
LTD of the mossy fiber–DCN synapse is induced by synaptic burst stimulation. A, DCN neurons were voltage clamped at −70 mV, and EPSCs were evoked by paired test pulses with a 100 ms interpulse interval. After a 5 min baseline recording period, a high-frequency synaptic burst stimulation (10 pulses at 100 Hz) was applied 20 times at 0.5 Hz, with or without paired postsynaptic depolarization (from −70 to −5 mV for 200 ms). Representative traces of the EPSC evoked by the first test pulse from time points indicated by a (black) and b (gray), respectively, on the time course graph (B) are shown. Traces shown are the average of 15 consecutive responses. B, Time course of the normalized evoked EPSC amplitude under control conditions (open circles; n = 6), postsynaptic depolarization alone (filled triangles; n = 5), high-frequency synaptic burst stimulation alone (open triangles; n = 6), and high-frequency synaptic burst stimulation paired with postsynaptic depolarization (filled circles; n = 13). The data from each neuron were normalized to the mean value of the first 5 min of recording. The arrow indicates the time point at which the stimulation was given. C, Time course of the paired-pulse ratio (second EPSC/first EPSC) under different conditions. Paired-pulse depression ratio did not change under all conditions over 30 min of recording. D, Quantification of the percentage change in EPSC amplitude averaged over the last 5 min. ∗∗p < 0.01 compared with control.
Figure 4.
Figure 4.
LTD of the mossy fiber–DCN synapse does not require activation of NMDA-Rs. A, LTD induced by the pairing protocol was not blocked in the presence of bath-applied 50 μm d-APV (n = 9). Representative traces of evoked EPSCs from the time points indicated by a (black) and b (gray), respectively, on B. B, Time course of the normalized evoked EPSC. Arrows indicate the time points at which the pairing protocol was applied. C, Time course of the paired-pulse ratio. D, Quantification of the percentage change in EPSC amplitude averaged over the last 5 min. The LTD induced by the pairing protocol with NMDA receptor blocked by 50 μm d-APV was not statistically significant from control LTD.
Figure 5.
Figure 5.
LTD of the mossy fiber–DCN synapse requires activation of mGluR1 but not mGluR5. A, LTD induced by the pairing protocol was abolished in the presence of bath-applied 125 μm CPCCOEt (an mGluR1 antagonist) or in the presence of 125 μm CPCCOEt and 10 μm MPEP (an mGluR5 antagonist) but not in the presence of 2 μm MPEP alone or in the presence of vehicle alone (0.145% DMSO). Representative traces of evoked EPSCs under different conditions from time points indicated by a (black) and b (gray), respectively, on B are shown. B, Time course of the normalized evoked EPSC amplitude in the presence of 125 μm CPCCOEt (filled triangles; n = 5), 125 μm CPCCOEt and 10 μm MPEP (open circles; n = 5), 2 μm MPEP (open triangles; n = 6), and vehicle (filled circles; n = 5). The arrow indicates the time point at which the pairing protocol was applied. C, Time course of the paired-pulse ratio under conditions shown in B. D, Quantification of the percentage change in EPSC amplitude averaged over the last 5 min. ∗∗p < 0.01 compared with control.
Figure 6.
Figure 6.
A postsynaptic Ca2+ transient is necessary for induction of LTD at the mossy fiber–DCN synapse. A, LTD induced by the pairing protocol was abolished in DCN neurons loaded with 40 mm BAPTA. Representative traces of the evoked EPSC from time points indicated by a (black) and b (gray), respectively, on B are shown. B, Time course of the normalized evoked EPSC amplitude (n = 6). The arrow indicates the time point at which the pairing protocol was applied. C, Time course of the paired-pulse ratio. D, Quantification of the percentage change in EPSC amplitude averaged over the last 5 min. ∗∗p < 0.01 compared with control.
Figure 7.
Figure 7.
LTD of the mossy fiber–DCN synapse requires rapid protein synthesis. A, LTD induced by the pairing protocol was abolished in the presence of mRNA translation blockers 20 μm anisomycin or 60 μm cycloheximide but not 25 μm actinomycin D (DNA transcription blocker). Representative traces of the evoked EPSC under different conditions from time points indicated by a (black) and b (gray), respectively, on B are shown. B, Time course of the normalized evoked EPSC amplitude in the presence of 20 μm anisomycin (filled circles; n = 12), 60 μm cycloheximide (open triangles; n = 6), or 25 μm actinomycin D (open circles; n = 5). The arrow indicates the time point at which the pairing protocol was applied. C, Time course of the paired-pulse ratio under conditions shown in B. D, Quantification of the percentage change in EPSC amplitude averaged over the last 5 min. ∗∗p < 0.01 compared with control.

Similar articles

Cited by

References

    1. Aizenman CD, Linden DJ (2000). Rapid, synaptically driven increases in the intrinsic excitability of cerebellar deep nuclear neurons. Nat Neurosci 3:109–111. - PubMed
    1. Aizenman CD, Manis PB, Linden DJ (1998). Polarity of long-term synaptic gain change is related to postsynaptic spike firing at a cerebellar inhibitory synapse. Neuron 21:827–835. - PubMed
    1. Aizenman CD, Huang EJ, Linden DJ (2003). Morphological correlates of intrinsic electrical excitability in neurons of the deep cerebellar nuclei. J Neurophysiol 89:1738–1747. - PubMed
    1. Akazawa C, Shigemoto R, Bessho Y, Nakanishi S, Mizuno N (1994). Differential expression of five N-methyl-d-aspartate receptor subunit mRNAs in the cerebellum of developing and adult rats. J Comp Neurol 347:150–160. - PubMed
    1. Anchisi D, Scelfo B, Tempia F (2001). Postsynaptic currents in deep cerebellar nuclei. J Neurophysiol 85:323–331. - PubMed

Publication types

Substances

LinkOut - more resources