c-Myc mediates pre-TCR-induced proliferation but not developmental progression
- PMID: 16788099
- PMCID: PMC1895574
- DOI: 10.1182/blood-2006-02-005900
c-Myc mediates pre-TCR-induced proliferation but not developmental progression
Abstract
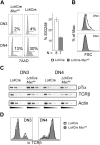
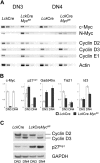
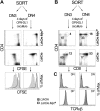
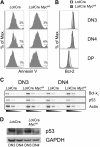
Constitutive and cell-autonomous signals emanating from the pre-T-cell receptor (pre-TCR) promote proliferation, survival and differentiation of immature thymocytes. We show here that induction of pre-TCR signaling resulted in rapid elevation of c-Myc protein levels. Cre-mediated thymocyte-specific ablation of c-Myc in CD25(+)CD44(-) thymocytes reduced proliferation and cell growth at the pre-TCR checkpoint, resulting in thymic hypocellularity and a severe reduction in CD4(+)CD8(+) thymocytes. In contrast, c-Myc deficiency did not inhibit pre-TCR-mediated differentiation or survival. Myc(-/-) double-negative (DN) 3 cells progressed to the double-positive (DP) stage and up-regulated TCRalphabeta surface expression in the absence of cell proliferation, in vivo as well as in vitro. These observations indicate that distinct signals downstream of the pre-TCR are responsible for proliferation versus differentiation, and demonstrate that c-Myc is only required for pre-TCR-induced proliferation but is dispensable for developmental progression from the DN to the DP stage.
Figures


Similar articles
-
Early growth response gene 3 regulates thymocyte proliferation during the transition from CD4-CD8- to CD4+CD8+.J Immunol. 2004 Jan 15;172(2):964-71. doi: 10.4049/jimmunol.172.2.964. J Immunol. 2004. PMID: 14707069
-
Maturation versus death of developing double-positive thymocytes reflects competing effects on Bcl-2 expression and can be regulated by the intensity of CD28 costimulation.J Immunol. 2001 Mar 1;166(5):3468-75. doi: 10.4049/jimmunol.166.5.3468. J Immunol. 2001. PMID: 11207305
-
c-Myc controls the development of CD8alphaalpha TCRalphabeta intestinal intraepithelial lymphocytes from thymic precursors by regulating IL-15-dependent survival.Blood. 2010 Jun 3;115(22):4431-8. doi: 10.1182/blood-2009-11-254698. Epub 2010 Mar 22. Blood. 2010. PMID: 20308599
-
Fc gamma RII/III and CD2 expression mark distinct subpopulations of immature CD4-CD8- murine thymocytes: in vivo developmental kinetics and T cell receptor beta chain rearrangement status.J Exp Med. 1993 Apr 1;177(4):1079-92. doi: 10.1084/jem.177.4.1079. J Exp Med. 1993. PMID: 8096236 Free PMC article.
-
The Ets-1 transcription factor is required for complete pre-T cell receptor function and allelic exclusion at the T cell receptor beta locus.Proc Natl Acad Sci U S A. 2004 Nov 2;101(44):15712-7. doi: 10.1073/pnas.0405546101. Epub 2004 Oct 20. Proc Natl Acad Sci U S A. 2004. PMID: 15496469 Free PMC article.
Cited by
-
MYC in Regulating Immunity: Metabolism and Beyond.Genes (Basel). 2017 Feb 25;8(3):88. doi: 10.3390/genes8030088. Genes (Basel). 2017. PMID: 28245597 Free PMC article. Review.
-
Single cell tuning of Myc expression by antigen receptor signal strength and interleukin-2 in T lymphocytes.EMBO J. 2015 Aug 4;34(15):2008-24. doi: 10.15252/embj.201490252. Epub 2015 Jul 1. EMBO J. 2015. PMID: 26136212 Free PMC article.
-
A critical role for Mnt in Myc-driven T-cell proliferation and oncogenesis.Proc Natl Acad Sci U S A. 2012 Nov 27;109(48):19685-90. doi: 10.1073/pnas.1206406109. Epub 2012 Nov 12. Proc Natl Acad Sci U S A. 2012. PMID: 23150551 Free PMC article.
-
The Transcription Factor Zfx Regulates Peripheral T Cell Self-Renewal and Proliferation.Front Immunol. 2018 Jul 4;9:1482. doi: 10.3389/fimmu.2018.01482. eCollection 2018. Front Immunol. 2018. PMID: 30022979 Free PMC article.
-
The Genetics and Mechanisms of T-Cell Acute Lymphoblastic Leukemia.Cold Spring Harb Perspect Med. 2020 Mar 2;10(3):a035246. doi: 10.1101/cshperspect.a035246. Cold Spring Harb Perspect Med. 2020. PMID: 31570389 Free PMC article. Review.
References
-
- Allman D, Sambandam A, Kim S, et al. Thymopoiesis independent of common lymphoid progenitors. Nat Immunol. 2003;4: 168-174. - PubMed
-
- Tan JB, Visan I, Yuan JS, Guidos CJ. Requirement for Notch1 signals at sequential early stages of intrathymic T cell development. Nat Immunol. 2005;6: 671-679. - PubMed
-
- Sambandam A, Maillard I, Zediak VP, et al. Notch signaling controls the generation and differentiation of early T lineage progenitors. Nat Immunol. 2005;6: 663-670. - PubMed
-
- Porritt HE, Rumfelt LL, Tabrizifard S, et al. Heterogeneity among DN1 prothymocytes reveals multiple progenitors with different capacities to generate T cell and non-T cell lineages. Immunity. 2004;20: 735-745. - PubMed
-
- Martin CH, Aifantis I, Scimone ML, et al. Efficient thymic immigration of B220+ lymphoid-restricted bone marrow cells with T precursor potential. Nat Immunol. 2003;4: 866-873. - PubMed
Publication types
MeSH terms
Substances
Grants and funding
LinkOut - more resources
Full Text Sources
Other Literature Sources
Molecular Biology Databases
Research Materials
Miscellaneous

