ROKU: a novel method for identification of tissue-specific genes
- PMID: 16764735
- PMCID: PMC1501047
- DOI: 10.1186/1471-2105-7-294
ROKU: a novel method for identification of tissue-specific genes
Abstract
Background: One of the important goals of microarray research is the identification of genes whose expression is considerably higher or lower in some tissues than in others. We would like to have ways of identifying such tissue-specific genes.
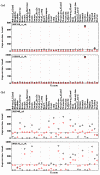
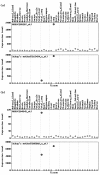
Results: We describe a method, ROKU, which selects tissue-specific patterns from gene expression data for many tissues and thousands of genes. ROKU ranks genes according to their overall tissue specificity using Shannon entropy and detects tissues specific to each gene if any exist using an outlier detection method. We evaluated the capacity for the detection of various specific expression patterns using synthetic and real data. We observed that ROKU was superior to a conventional entropy-based method in its ability to rank genes according to overall tissue specificity and to detect genes whose expression pattern are specific only to objective tissues.
Conclusion: ROKU is useful for the detection of various tissue-specific expression patterns. The framework is also directly applicable to the selection of diagnostic markers for molecular classification of multiple classes.
Figures


Similar articles
-
Detecting and profiling tissue-selective genes.Physiol Genomics. 2006 Jul 12;26(2):158-62. doi: 10.1152/physiolgenomics.00313.2005. Epub 2006 May 9. Physiol Genomics. 2006. PMID: 16684803
-
GO based tissue specific functions of mouse using countable gene expression profiles.Genome Inform. 2007;19:154-65. Genome Inform. 2007. PMID: 18546513
-
Tumor classification ranking from microarray data.BMC Genomics. 2008 Sep 16;9 Suppl 2(Suppl 2):S21. doi: 10.1186/1471-2164-9-S2-S21. BMC Genomics. 2008. PMID: 18831787 Free PMC article.
-
eXPRESSION: an in silico tool to predict patterns of gene expression.Gene Expr Patterns. 2005 Jun;5(5):619-28. doi: 10.1016/j.modgep.2005.03.003. Epub 2005 Apr 19. Gene Expr Patterns. 2005. PMID: 15939374
-
MicroRNA expression profiling in cancer from a bioinformatics prospective.Expert Rev Mol Diagn. 2007 Nov;7(6):787-92. doi: 10.1586/14737159.7.6.787. Expert Rev Mol Diagn. 2007. PMID: 18020908 Review.
Cited by
-
Genome-wide prediction and analysis of human tissue-selective genes using microarray expression data.BMC Med Genomics. 2013;6 Suppl 1(Suppl 1):S10. doi: 10.1186/1755-8794-6-S1-S10. Epub 2013 Jan 23. BMC Med Genomics. 2013. PMID: 23369200 Free PMC article.
-
DESE: estimating driver tissues by selective expression of genes associated with complex diseases or traits.Genome Biol. 2019 Nov 6;20(1):233. doi: 10.1186/s13059-019-1801-5. Genome Biol. 2019. PMID: 31694669 Free PMC article.
-
SpeCond: a method to detect condition-specific gene expression.Genome Biol. 2011 Oct 18;12(10):R101. doi: 10.1186/gb-2011-12-10-r101. Genome Biol. 2011. PMID: 22008066 Free PMC article.
-
Transcriptome Dynamics of Human Neuronal Differentiation From iPSC.Front Cell Dev Biol. 2021 Dec 14;9:727747. doi: 10.3389/fcell.2021.727747. eCollection 2021. Front Cell Dev Biol. 2021. PMID: 34970540 Free PMC article.
-
TransTEx: novel tissue-specificity scoring method for grouping human transcriptome into different expression groups.Bioinformatics. 2024 Aug 2;40(8):btae475. doi: 10.1093/bioinformatics/btae475. Bioinformatics. 2024. PMID: 39120880 Free PMC article.
References
-
- Kadota K, Nishimura SI, Bono H, Nakamura S, Hayashizaki Y, Okazaki Y, Takahashi K. Detection of genes with tissue-specific expression patterns using Akaike's Information Criterion (AIC) procedure. Physiol Genomics. 2003;12:251–259. - PubMed
Publication types
MeSH terms
LinkOut - more resources
Full Text Sources

