

Myostatin regulates cardiomyocyte growth through modulation of Akt signaling
- PMID: 16763166
- PMCID: PMC2901846
- DOI: 10.1161/01.RES.0000231290.45676.d4
Myostatin regulates cardiomyocyte growth through modulation of Akt signaling
Abstract
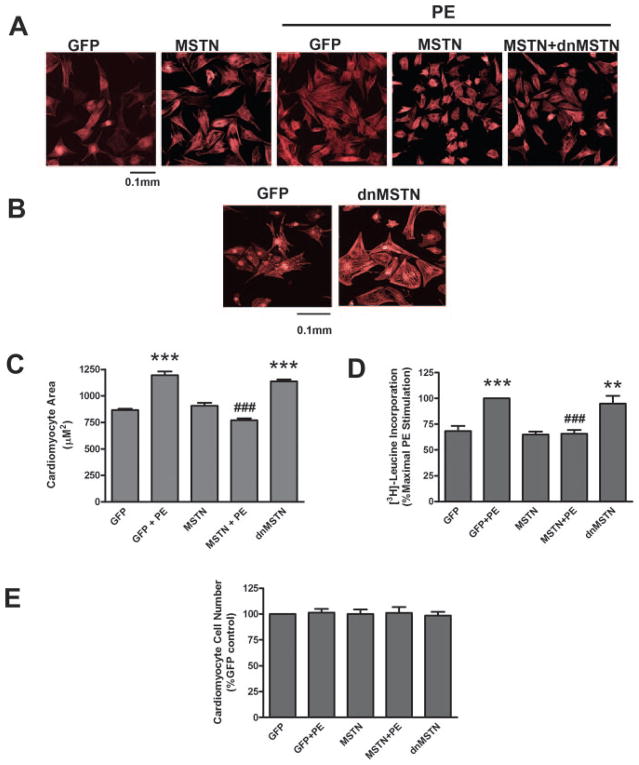
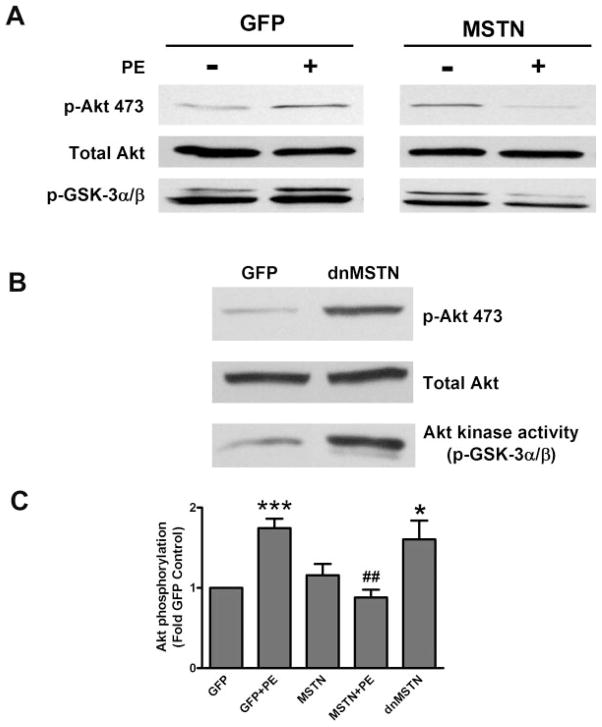
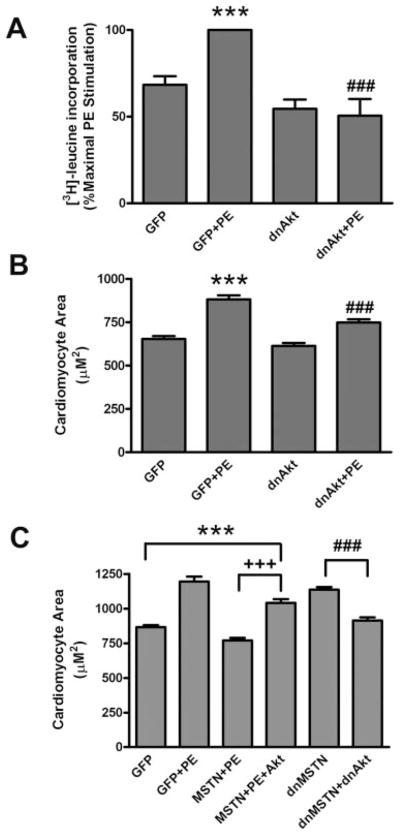
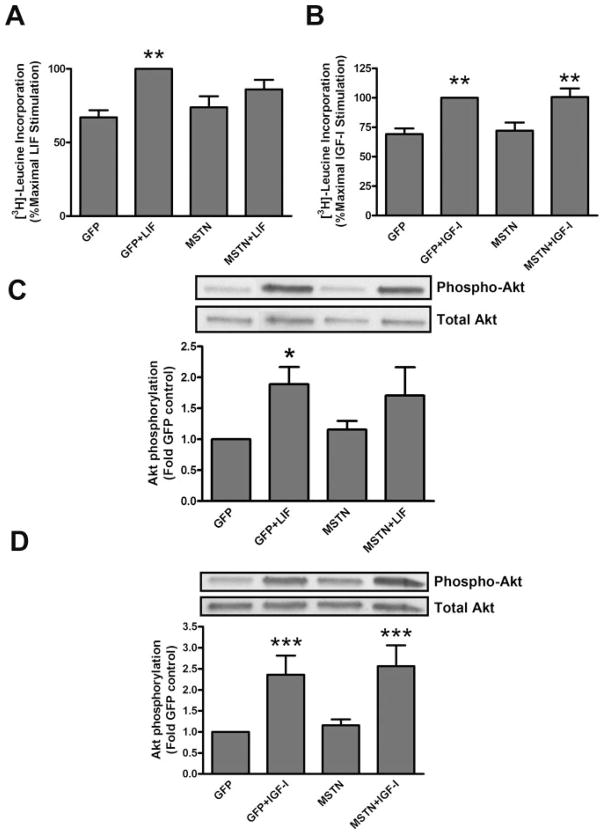
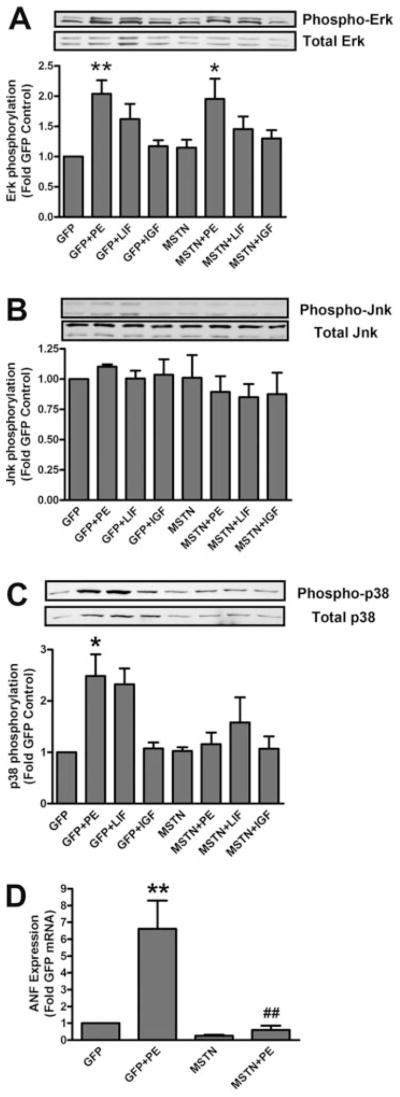
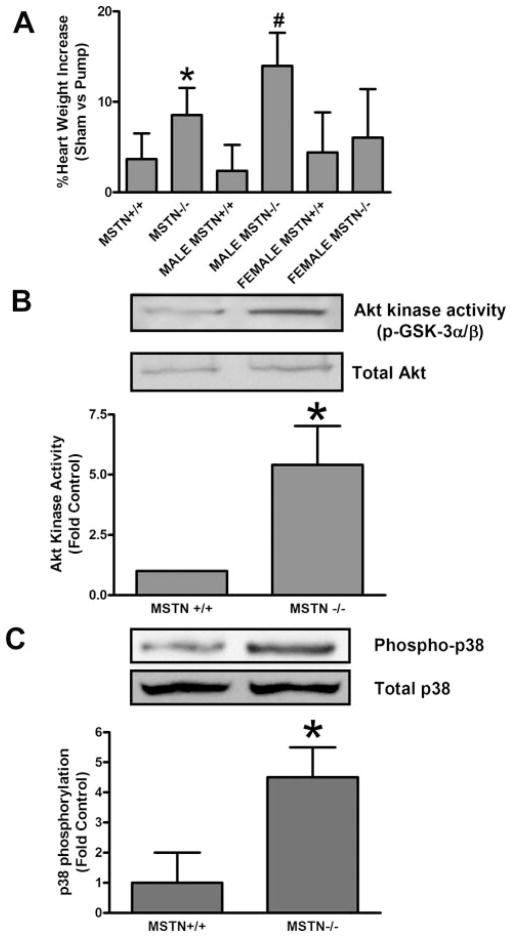
Myostatin is a highly conserved, potent negative regulator of skeletal muscle hypertrophy in many species, from rodents to humans, although its mechanisms of action are incompletely understood. Transcript profiling of hearts from a genetic model of cardiac hypertrophy revealed dramatic upregulation of myostatin, not previously recognized to play a role in the heart. Here we show that myostatin abrogates the cardiomyocyte growth response to phenylephrine in vitro through inhibition of p38 and the serine-threonine kinase Akt, a critical determinant of cell size in many species from drosophila to mammals. Evaluation of male myostatin-null mice revealed that their cardiomyocytes and hearts overall were slightly smaller at baseline than littermate controls but exhibited more exuberant growth in response to chronic phenylephrine infusion. The increased cardiac growth in myostatin-null mice corresponded with increased p38 phosphorylation and Akt activation in vivo after phenylephrine treatment. Together, these data demonstrate that myostatin is dynamically regulated in the heart and acts more broadly than previously appreciated to regulate growth of multiple types of striated muscle.
Figures

Similar articles
-
Myostatin is upregulated following stress in an Erk-dependent manner and negatively regulates cardiomyocyte growth in culture and in a mouse model.PLoS One. 2010 Apr 19;5(4):e10230. doi: 10.1371/journal.pone.0010230. PLoS One. 2010. PMID: 20419100 Free PMC article.
-
Myostatin inhibits IGF-I-induced myotube hypertrophy through Akt.Am J Physiol Cell Physiol. 2009 Nov;297(5):C1124-32. doi: 10.1152/ajpcell.00043.2009. Epub 2009 Sep 16. Am J Physiol Cell Physiol. 2009. PMID: 19759331 Free PMC article.
-
Transcriptional effects of chronic Akt activation in the heart.J Biol Chem. 2002 Jun 21;277(25):22528-33. doi: 10.1074/jbc.M201462200. Epub 2002 Apr 15. J Biol Chem. 2002. PMID: 11956204
-
PI3 kinase regulation of skeletal muscle hypertrophy and atrophy.Curr Top Microbiol Immunol. 2010;346:267-78. doi: 10.1007/82_2010_78. Curr Top Microbiol Immunol. 2010. PMID: 20593312 Review.
-
Signaling pathways weigh in on decisions to make or break skeletal muscle.Curr Opin Clin Nutr Metab Care. 2004 Jul;7(4):443-50. doi: 10.1097/01.mco.0000134364.61406.26. Curr Opin Clin Nutr Metab Care. 2004. PMID: 15192448 Review.
Cited by
-
Myostatin: A Skeletal Muscle Chalone.Annu Rev Physiol. 2023 Feb 10;85:269-291. doi: 10.1146/annurev-physiol-012422-112116. Epub 2022 Oct 20. Annu Rev Physiol. 2023. PMID: 36266260 Free PMC article. Review.
-
Myostatin and IGF-I signaling in end-stage human heart failure: a qRT-PCR study.J Transl Med. 2015 Jan 16;13:1. doi: 10.1186/s12967-014-0365-0. J Transl Med. 2015. PMID: 25591711 Free PMC article.
-
Signals of Ezh2, Src, and Akt Involve in myostatin-Pax7 pathways regulating the myogenic fate determination during the sheep myoblast proliferation and differentiation.PLoS One. 2015 Mar 26;10(3):e0120956. doi: 10.1371/journal.pone.0120956. eCollection 2015. PLoS One. 2015. PMID: 25811841 Free PMC article.
-
Endocrine actions of myostatin: systemic regulation of the IGF and IGF binding protein axis.Endocrinology. 2011 Jan;152(1):172-80. doi: 10.1210/en.2010-0488. Epub 2010 Dec 8. Endocrinology. 2011. PMID: 21147879 Free PMC article.
-
Peripheral venous occlusion causing cardiac hypertrophy and changes in biological parameters in rats.Eur J Appl Physiol. 2009 Apr;105(6):909-17. doi: 10.1007/s00421-008-0977-2. Epub 2009 Jan 6. Eur J Appl Physiol. 2009. PMID: 19125275
References
-
- Matsui T, Li L, Wu JC, Cook SA, Nagoshi T, Picard MH, Liao R, Rosenzweig A. Phenotypic spectrum caused by transgenic overexpression of activated Akt in the heart. J Biol Chem. 2002;277:22896–22901. - PubMed
-
- Verdu J, Buratovich MA, Wilder EL, Birnbaum MJ. Cell-autonomous regulation of cell and organ growth in Drosophila by Akt/PKB. Nat Cell Biol. 1999;1:500–506. - PubMed
-
- Scanga SE, Ruel L, Binari RC, Snow B, Stambolic V, Bouchard D, Peters M, Calvieri B, Mak TW, Woodgett JR, Manoukian AS. The conserved PI33K/PTEN/Akt signaling pathway regulates both cell size and survival in Drosophila. Oncogene. 2000;19:3971–3977. - PubMed
-
- Bodine SC, Stitt TN, Gonzalez M, Kline WO, Stover GL, Bauerlein R, Zlotchenko E, Scrimgeour A, Lawrence JC, Glass DJ, Yancopoulos GD. Akt/mTOR pathway is a crucial regulator of skeletal muscle hypertrophy and can prevent muscle atrophy in vivo. Nat Cell Biol. 2001;3:1014–1019. - PubMed
-
- Cook SA, Matsui T, Li L, Rosenzweig A. Transcriptional effects of chronic Akt activation in the heart. J Biol Chem. 2002;277:22528–22533. - PubMed
Publication types
MeSH terms
Substances
Grants and funding
LinkOut - more resources
Full Text Sources
Other Literature Sources
Molecular Biology Databases
Miscellaneous
