. 2006 Jun 12;203(6):1519-32.
doi: 10.1084/jem.20051210. Epub 2006 Jun 5.

Venular basement membranes contain specific matrix protein low expression regions that act as exit points for emigrating neutrophils

Affiliations

Venular basement membranes contain specific matrix protein low expression regions that act as exit points for emigrating neutrophils

Shijun Wang et al. J Exp Med. .

Abstract

The mechanism of leukocyte migration through venular walls in vivo is largely unknown. By using immunofluorescence staining and confocal microscopy, the present study demonstrates the existence of regions within the walls of unstimulated murine cremasteric venules where expression of key vascular basement membrane (BM) constituents, laminin 10, collagen IV, and nidogen-2 (but not perlecan) are considerably lower (<60%) than the average expression detected in the same vessel. These sites were closely associated with gaps between pericytes and were preferentially used by migrating neutrophils during their passage through cytokine-stimulated venules. Although neutrophil transmigration did not alter the number/unit area of extracellular matrix protein low expression sites, the size of these regions was enlarged and their protein content was reduced in interleukin-1beta-stimulated venules. These effects were entirely dependent on the presence of neutrophils and appeared to involve neutrophil-derived serine proteases. Furthermore, evidence was obtained indicating that transmigrating neutrophils carry laminins on their cell surface in vivo. Collectively, through identification of regions of low extracellular matrix protein localization that define the preferred route for transmigrating neutrophils, we have identified a plausible mechanism by which neutrophils penetrate the vascular BM without causing a gross disruption to its intricate structure.


Figures
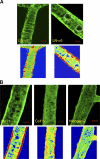
Figure 1.
Figure 1.
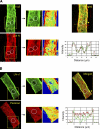
Expression profiles of basement membrane proteins in unstimulated cremasteric vessel walls: identification of LE regions. The figure shows representative three-dimensional images of “semi-vessels” of unstimulated cremasteric microvessels immunostained for different matrix proteins. (A) Expression of LN-α5 chain (detecting laminin 10) in an arteriole (left) and venule (right), with corresponding intensity profiles (below the images). The color coding shows low intensity sites as blue and high intensity sites as red. Representative laminin 10 LE regions in the imaged venular wall are indicated by white circles. (B) Expressions of laminin γ1 (constituent of both laminins 8 and 10), collagen IV, and nidogen-2 and their corresponding intensity profiles. Each image is representative of at least five vessels/tissue (at least n = 4 mice per group). Bar, 10 μm.
Figure 2.
Figure 2.
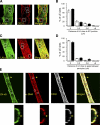
Laminin 10 LE regions also express low levels of collagen IV but continuous expression of perlecan. The panels show unstimulated cremasteric venules double stained as follows. (A) Laminin α5 chain (detecting laminin 10) and collagen IV and (B) laminin γ1 chain (constituent of both laminins 8 and 10) and perlecan. In both panels, the vessel segment indicated in the boxed area is shown at a higher magnification (together with its corresponding image intensity profile) to better illustrate the expression profiles of molecules under investigation (middle). The positions of the same representative laminin LE sites are shown in all four middle images in each panel. On the right in each panel, histogram plots of a latitudinal section of the vessel, cutting through selected laminin LE sites, are shown to illustrate the colocalization of laminin LE sites with collagen IV LE regions (A, right) and the continuous expression of perlecan at laminin LE sites (B, right). In these panels, laminin fluorescence intensity (arbitrary units) is shown in green and collagen IV and perlecan intensities are shown in red. Each image is representative of three to five vessels/tissue (n = 3–4 mice per group). Bar, 10 μm.
Figure 3.
Figure 3.
Localization of laminin 10 and collagen IV LE regions with endothelial cell junctions and gaps between pericytes. To investigate the localization of laminin 10 (as detected by an anti–LN-α5) and collagen IV LE regions in relation to endothelial cells and pericytes, unstimulated cremaster muscle tissues were double stained for the extracellular matrix protein of interest together with either CD31 (as an endothelial cell marker) or α-SMA (as a pericyte marker). All images shown are from semi-vessels. (A) Representative three-dimensional images of venules immunostained for LN-α5 and CD31. White rings indicate the position of selected LE regions, some indicating a high association with endothelial cell junctions. (B) Graph shows the percentage of laminin 10 (white bars) and collagen IV (black bars) LE sites at different distances from their closest endothelial cell junction. (C) Representative three-dimensional images of venules immunostained for LN-α5 and α-SMA. White rings indicate the position of selected LE regions clearly indicating the high association of their localization with gaps between pericytes. (D) The graph shows the percentage of laminin 10 (white bars) and collagen IV (black bars) LE regions at different distances from pericyte gaps. In these studies, a total of 650 LE sites, observed in three to five vessels in three to four mice per group, were analyzed. (E) A representative venule triple stained for LN-α5, α-SMA, and CD31 is shown, indicating the high association of laminin 10 LE regions (selected examples shown by rings) with pericyte gaps and endothelial cell junctions. The bottom panels were obtained by cutting a cross section of the venule (1-μm thick) along the indicated line through a selected LE region. These representative images further indicate the direct colocalization of a laminin 10 LE site with an α-SMA–negative region and in close proximity of an endothelial cell junction (as indicated by discrete regions of high fluorescence intensity). Bar, 10 μm.
Figure 4.
Figure 4.
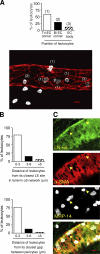
Association of neutrophils in IL-1β–stimulated tissues with endothelial cell junctions, LE sites in the laminin 10 network, and gaps between pericytes. (A) IL-1β–stimulated mouse cremasteric tissues (50 ng/mouse injected intrascrotally, 4-h time point) were immunostained for the endothelial cell (EC) marker CD31 (red) and neutrophil marker MRP-14 (white). Three-dimensional images of semi-vessels of interest were captured and association of neutrophils with different EC junctions (i.e., found at tricellular or bicellular junctions) or the EC body was quantified. The graph shows the percentage of neutrophils at different positions relative to EC junctions. A representative fluorescence micrograph is shown in which examples of positions of neutrophils at tri-EC junctions, bi-EC junctions, and EC body are indicated by “(1),” “(2),” and “(3),” respectively. The corresponding bars on the graph are labeled with the same numbering scheme. For these studies, a total of 108 the percentage of neutrophils within different distance ranges from their closest LN-α5 LE sites (top) and gaps between pericytes (bottom). (C) Images show representative fluorescent micrographs of venules (semi-vessels) in IL-1β–stimulated tissues triple stained for laminin 10 (LN-α5 chain), α-SMA, and MRP-14. Selected regions of laminin LE sites are shown by arrows. Results are from four to five vessel segments/tissue (n = 6 cremaster muscles). Bar, 10 μm.
Figure 5.
Figure 5.
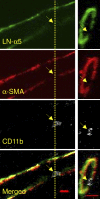
In IL-1β–stimulated tissues, neutrophils migrate through laminin 10 LE sites and gaps between pericytes. IL-1β–stimulated mouse cremasteric tissues (50 ng/mouse injected intrascrotally, 4-h reaction) were immunostained for laminin 10 (LN-α5 chain), α-SMA (pericyte marker), and CD11b (leukocyte marker) and analyzed by confocal microscopy. The images on the left are from a midline optical section of a three-dimensional image of a whole venule along its longitudinal axis. The images on the right were obtained by cutting a cross section of the venule along the indicated yellow line. These representative images clearly indicate colocalization of a laminin 10 LE site, a pericyte gap, and a transmigrating leukocyte (all indicated by yellow arrows). Bar, 10 μm.
Figure 6.
Figure 6.
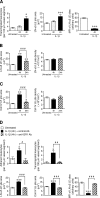
Average size and intensity, but not number/unit area, of LE sites in both laminin 10 and collagen IV networks is increased in IL-1β–stimulated tissues in a neutrophil-dependent manner. Leukocyte responses of firm adhesion and/or transmigration were quantified in untreated or IL-1β (50 ng/mouse)–stimulated mouse cremaster muscles by intravital microscopy at indicated time points after i.s. injection of IL-1β. In some experiments, after in vivo analysis of responses, tissues were dissected from the mice and immunostained for laminin 10 (LN-α5 chain) or collagen IV. Three-dimensional images of venules were scanned and density (number/unit area), area, and average fluorescence intensity of matrix protein LE sites were measured as described in Materials and methods. (A) The two graphs on the left show time course of neutrophil transmigration and area of LE sites within the LN-α5 network in untreated tissues and in tissues stimulated for the indicated periods with IL-1β. The graph on the right shows mean of fluorescence intensity (MFI, arbitrary units) of LE regions. (B) The graphs show the area (left) and density (right) of LE sites within the LN-α5 network in untreated tissues and in tissues stimulated for the indicated periods with IL-1β. (C) Similarly, the graphs show the area (left) and density (right) of collagen IV LE sites in untreated and IL-1β–stimulated tissues. (D) Mice were depleted of their circulating neutrophils by injection of anti-GR1 mAb and control mice were injected with an isotype-matched control mAb (100 mg i.p. for both mAbs). 24 h later, mice were injected i.s. with IL-1β (50 ng/mouse) and 4 h later leukocyte adhesion and transmigration was quantified by intravital microscopy. At the end of the in vivo test period, cremaster muscle tissues were dissected away, fixed, and immunostained for laminin 10 (LN-α5) or collagen IV and the size and/or intensity (MFI) of LE regions were quantified as detailed in Materials and methods. In all panels, a total of 316–716 LE sites from three to seven vessel segments/tissue (n = 3–4 mice per group) were analyzed. Significant differences in responses in IL-1β–stimulated tissues as compared with unstimulated tissues are indicated by asterisks, *, P < 0.05 and ***, P < 0.001. Further comparisons are shown by lines. #, P < 0.05; ##, P < 0.01; and ###, P < 0.001.
Figure 7.
Figure 7.
Role of NE in laminin disruption in vivo and in vitro. (A) WT or NE−/− mice were injected via the intrascrotal (i.s.) route with IL-1β (50 ng/mouse) (control mice were untreated). (B) WT or NE−/− mice were injected with i.s. IL-1β (control mice were untreated) and 2 h later a continuous infusion of the specific NE inhibitor, ONO-5046, or aprotinin (see Materials and methods for dosing regimes) was injected to the mice (control mice received an infusion of saline). In all experiments, 2–4 h after injection of IL-1β (as indicated), leukocyte transmigration in cremasteric venules was quantified by intravital microscopy as detailed in Materials and methods. At the end of the in vivo test period, cremaster muscles were dissected away from mice, fixed, and immunostained with an anti–LN-α5 Ab and/or anti–collagen IV (coll IV) Ab and the size of LE regions was evaluated as detailed in Materials and methods. In all panels, a total of 300–716 LE sites, from 3 to 22 vessel segments, using three to nine mice per group were analyzed. Significant differences in responses in IL-1β–stimulated tissues as compared with unstimulated tissues are indicated by asterisks (*, P < 0.05; **, P < 0.01; and ***, P < 0.001) and further comparisons are shown by cross-hatched lines (#, P < 0.05; ##, P < 0.01; and ###, P < 0.001). (C) 96-well NeuroProbe chemotaxis chambers were used for investigating neutrophil migration through laminin-1–coated filters as detailed in Materials and methods. In brief, bone marrow–derived mouse neutrophils (untreated or treated with 50 μM of the NE inhibitor ONO-5046) were placed on top of the filters with IL-8 (10−7 M) in the bottom wells. After an incubation period of 1.5 h at 37°C, the filters were immunostained for laminin-1 (red) and the leukocytes were stained with the nuclear dye SytoxGreen (green). Results are representative of three independent experiments. Bar, 10 μm.
Figure 8.
Figure 8.
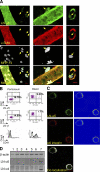
Transmigrated neutrophils carry laminin on their cell surface. (A) IL-1β–stimulated mouse cremasteric muscles were immunostained for LN-α5 chain, α-SMA (pericyte marker), and MRP-14 (neutrophil marker), and three-dimensional images of whole vessels were collected by confocal microscopy. The fluorescence micrographs show cross-sectional images and three-dimensional images of the same venular segment in which a transmigrating neutrophil (arrows) is shown to be LN-α5 chain positive. Bar, 10 μm. (B) Mice were injected i.p. with thioglycollate and peritoneal cells were harvested at 2 h after administration of the stimulus. Cell surface expression of LN-α5 and -γ1 subunits on blood or peritoneal neutrophils were quantified by flow cytometry and results are shown as scatter profiles. The numbers in each scatter profile shown in bold represent percent of positive cells. The cell samples were also stained for CD41 (platelet marker) at 4 h after stimulation. The results are representative of three independent experiments. (C) IL-1β–elicited transmigrated peritoneal leukocytes were immunostained for LN-α5 chain and α6 integrin and analyzed by confocal microscopy. Representative images of midlevel sections of cells are shown together with their corresponding intensity profiles (right). Colocalization of LN-α5 and α6 integrin was better indicated using the LSM 5 Pascal software that allows colocalized pixels of the two fluorescence channels to be visually shown by a white mask superimposed onto the original RGB image. (D) RT-PCR analysis for β-actin, LN-α5, and α4 chains from purified neutrophils (lanes 1, 3, 5) and residual mononuclear cells (lanes 2, 4, 6) harvested from thioglycollate (lanes 1–4) or IL-1β (lanes 5–6) elicited peritonitis studies. Confluent murine cardiac endothelial cells (lane 7) were used as a positive control.

Similar articles

Cited by

References

    1. Vestweber, D., and J.E. Blanks. 1999. Mechanisms that regulate the function of the selectins and their ligands. Physiol. Rev. 79:181–213. - PubMed
    1. Alon, R., and S. Feigelson. 2002. From rolling to arrest on blood vessels: leukocyte tap dancing on endothelial integrin ligands and chemokines at sub-second contacts. Semin. Immunol. 14:93–104. - PubMed
    1. Huber, A.R., and S.J. Weiss. 1989. Disruption of the subendothelial basement membrane during neutrophil diapedesis in an in vitro construct of a blood vessel wall. J. Clin. Invest. 83:1122–1136. - PMC - PubMed
    1. Yadav, R., K.Y. Larbi, R.E. Young, and S. Nourshargh. 2003. Migration of leukocytes through the vessel wall and beyond. Thromb. Haemost. 90:598–606. - PubMed
    1. Mandarino, L.J., N. Sundarraj, J. Finlayson, and J.R. Hassell. 1993. Regulation of fibronectin and laminin synthesis by retinal capillary endothelial cells and pericytes in vitro. Exp. Eye Res. 57:609–621. - PubMed

Publication types