

Relationships between host viremia and vector susceptibility for arboviruses
- PMID: 16739425
- PMCID: PMC2814772
- DOI: 10.1603/0022-2585(2006)43[623:rbhvav]2.0.co;2
Relationships between host viremia and vector susceptibility for arboviruses
Abstract
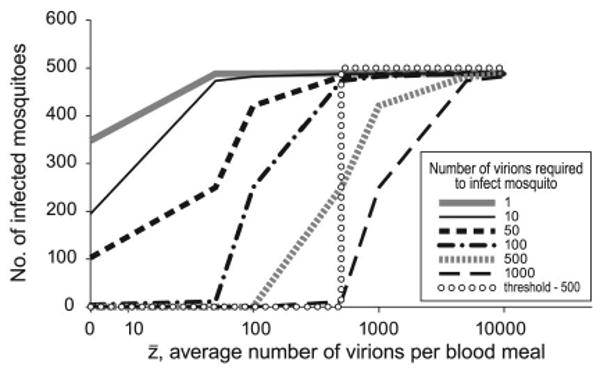
Using a threshold model where a minimum level of host viremia is necessary to infect vectors affects our assessment of the relative importance of different host species in the transmission and spread of these pathogens. Other models may be more accurate descriptions of the relationship between host viremia and vector infection. Under the threshold model, the intensity and duration of the viremia above the threshold level is critical in determining the potential numbers of infected mosquitoes. A probabilistic model relating host viremia to the probability distribution of virions in the mosquito bloodmeal shows that the threshold model will underestimate the significance of hosts with low viremias. A probabilistic model that includes avian mortality shows that the maximum number of mosquitoes is infected by feeding on hosts whose viremia peaks just below the lethal level. The relationship between host viremia and vector infection is complex, and there is little experimental information to determine the most accurate model for different arthropod-vector-host systems. Until there is more information, the ability to distinguish the relative importance of different hosts in infecting vectors will remain problematic. Relying on assumptions with little support may result in erroneous conclusions about the importance of different hosts.
Figures


Similar articles
-
Amplification due to spatial clustering in an individual-based model of mosquito-avian arbovirus transmission.Trans R Soc Trop Med Hyg. 2007 May;101(5):469-83. doi: 10.1016/j.trstmh.2006.11.007. Epub 2007 Jan 31. Trans R Soc Trop Med Hyg. 2007. PMID: 17270228
-
Tissue Barriers to Arbovirus Infection in Mosquitoes.Viruses. 2015 Jul 8;7(7):3741-67. doi: 10.3390/v7072795. Viruses. 2015. PMID: 26184281 Free PMC article. Review.
-
Unraveling Host-Vector-Arbovirus Interactions by Two-Gene High Resolution Melting Mosquito Bloodmeal Analysis in a Kenyan Wildlife-Livestock Interface.PLoS One. 2015 Jul 31;10(7):e0134375. doi: 10.1371/journal.pone.0134375. eCollection 2015. PLoS One. 2015. PMID: 26230507 Free PMC article.
-
Avian host and mosquito (Diptera: Culicidae) vector competence determine the efficiency of West Nile and St. Louis encephalitis virus transmission.J Med Entomol. 2005 May;42(3):367-75. doi: 10.1093/jmedent/42.3.367. J Med Entomol. 2005. PMID: 15962789
-
The role of co-infection and swarm dynamics in arbovirus transmission.Virus Res. 2019 May;265:88-93. doi: 10.1016/j.virusres.2019.03.010. Epub 2019 Mar 14. Virus Res. 2019. PMID: 30879977 Review.
Cited by
-
Zika virus threshold determines transmission by European Aedes albopictus mosquitoes.Emerg Microbes Infect. 2019;8(1):1668-1678. doi: 10.1080/22221751.2019.1689797. Emerg Microbes Infect. 2019. PMID: 31735122 Free PMC article.
-
Effects of infectious virus dose and bloodmeal delivery method on susceptibility of Aedes aegypti and Aedes albopictus to chikungunya virus.J Med Entomol. 2009 Mar;46(2):395-9. doi: 10.1603/033.046.0228. J Med Entomol. 2009. PMID: 19351094 Free PMC article.
-
Tracking Rift Valley fever: From Mali to Europe and other countries, 2016.Euro Surveill. 2019 Feb;24(8):1800213. doi: 10.2807/1560-7917.ES.2019.24.8.1800213. Euro Surveill. 2019. PMID: 30808441 Free PMC article.
-
Impacts of Infectious Dose, Feeding Behavior, and Age of Culicoides sonorensis Biting Midges on Infection Dynamics of Vesicular Stomatitis Virus.Pathogens. 2021 Jun 29;10(7):816. doi: 10.3390/pathogens10070816. Pathogens. 2021. PMID: 34209902 Free PMC article.
-
Can Horton hear the whos? The importance of scale in mosquito-borne disease.J Med Entomol. 2014 Mar;51(2):297-313. doi: 10.1603/me11168. J Med Entomol. 2014. PMID: 24724278 Free PMC article.
References
-
- Aguirre AA, McLean RG, Cook RS. Experimental inoculation of three arboviruses in black-bellied whistling ducks (Dendrocygna autumnalis) J Wildl Dis. 1992;28:521–525. - PubMed
-
- Bretz F, Hothorn LA. Detecting dose-response using contrasts: asymptotic power and sample size determination for binomial data. Stat Med. 2002;21:3325–3335. - PubMed
-
- Chamberlain RW, Sikes RK, Nelson DB, Sudia WD. Studies on the North American arthropod-borne encephalitides. VI. Quantitative determinations of virus-vector relationships. Am J Hyg. 1954;60:278–285. - PubMed
Publication types
MeSH terms
Grants and funding
LinkOut - more resources
Full Text Sources
