. 2006 Jun;116(6):1675-85.
doi: 10.1172/JCI26856. Epub 2006 May 18.

Reprogramming of antiviral T cells prevents inactivation and restores T cell activity during persistent viral infection

Affiliations

Reprogramming of antiviral T cells prevents inactivation and restores T cell activity during persistent viral infection

David G Brooks et al. J Clin Invest. 2006 Jun.

Abstract

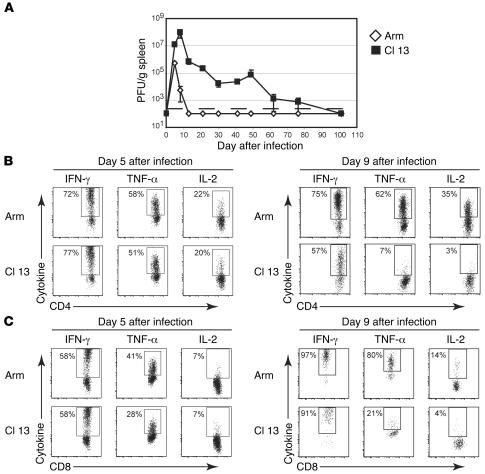
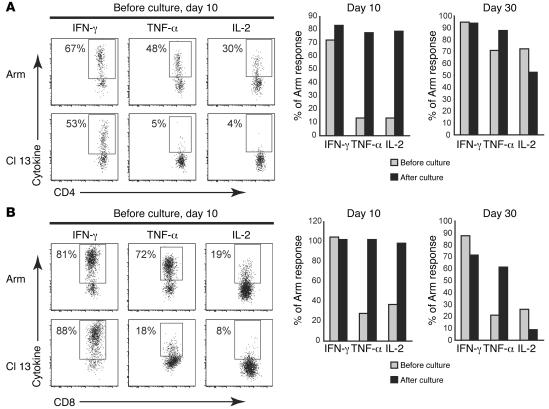
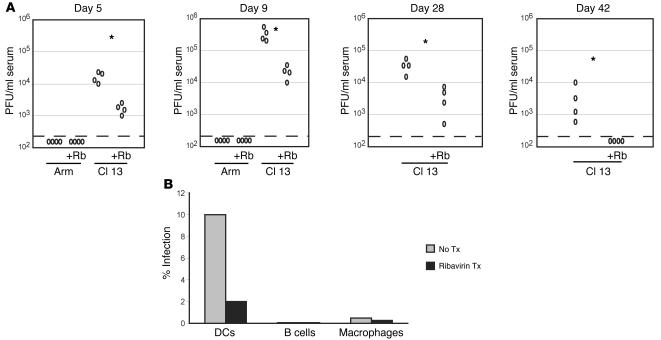
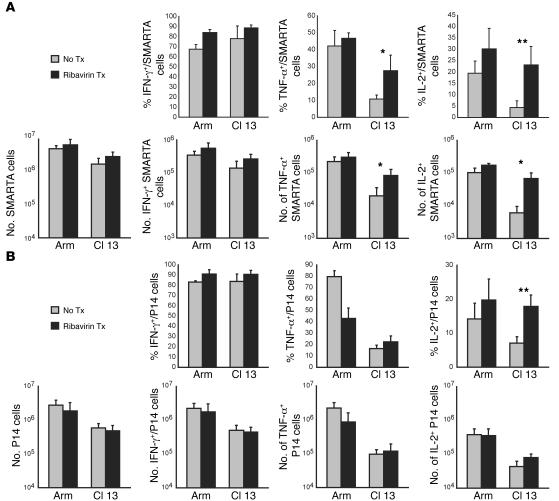
Failure to clear persistent viral infections results from the early loss of T cell activity. A pertinent question is whether the immune response is programmed to fail or if nonresponsive T cells can specifically be fixed to eliminate infection. Although evidence indicates that T cell expansion is permanently programmed during the initial priming events, the mechanisms that determine the acquisition of T cell function are less clear. Herein we show that in contrast to expansion, the functional programming of T cell effector and memory responses in vivo in mice is not hardwired during priming but is alterable and responsive to continuous instruction from the antigenic environment. As a direct consequence, dysfunctional T cells can be functionally reactivated during persistent infection even after an initial program of inactivation has been instituted. We also show that early therapeutic reductions in viral replication facilitate the preservation of antiviral CD4+ T cell activity, enabling the long-term control of viral replication. Thus, dysfunctional antiviral T cells can regain activity, providing a basis for future therapeutic strategies to treat persistent viral infections.


Figures

Figure 1
Figure 1. Virus-specific CD4+ and CD8+ T cells lose initially strong activity during the establishment of a persistent viral infection.
(A) Spleens were isolated from LCMV Arm– (open diamonds) and Cl 13–infected (filled squares) animals and titers of infectious virus determined by plaque assay. Data are expressed as plaque forming units per gram of spleen. The dashed line indicates the lower limit of detection (200 PFU/g spleen). Each time point represents the average ± 1 SD of 3 mice per group. (B and C) LCMV-specific SMARTA (TCR Tg CD4+ T cells) (B) and P14 (TCR Tg CD8+ T cells) cells (C) were cotransferred into mice that were subsequently infected with LCMV Arm or Cl 13. On days 5 (left panels) and 9 (right panels) after infection, splenocytes from individual mice were isolated and the frequency of IFN-γ–, TNF-α–, and IL-2–producing SMARTA and P14 cells assessed by intracellular cytokine staining. The flow plots are gated on SMARTA (B) and P14 (C) cells, and the values represent the percentage of cytokine-producing cells. The flow plots are representative of 4 independent experiments containing 4 mice per group.
Figure 2
Figure 2. T cell function is not programmed during priming but is an ongoing process.
(A) SMARTA and P14 cells were cotransferred into mice, followed 2 days later by infection with LCMV Arm or Cl 13. Five days after infection, following T cell priming, splenocytes from LCMV Arm– or Cl 13–infected mice were isolated and pooled separately. B cells were depleted by positive selection, and the remaining “untouched” splenocytes were transferred into recipient mice infected in parallel with LCMV Arm or Cl 13 five days earlier but not given SMARTA and P14 cells. T cells from the recipient mice were analyzed at 9 and 40 days after infection. (B and C) Cotransferred SMARTA and P14 cells were primed in LCMV Arm– or Cl 13–infected animals for 5 days and then transferred into mice infected in parallel with either LCMV Arm or Cl 13 four (top panels) and 35 (bottom panels) days following transfer of the primed cells (days 9 and 40 after infection, respectively). Splenocytes from each mouse were isolated, and the ability of the cotransferred SMARTA (B) and P14 cells (C) to produce IFN-γ, TNF-α, and IL-2 was analyzed by intracellular flow cytometry. The type of infection in which the cells were primed is indicated underneath each graph. Gray and black bars represent transfer into LCMV Arm– and Cl 13–infected recipients, respectively. The bars represent the average ± SD of 4 mice in each group and are representative of 2–4 experiments. Note that the scales on the y axis differ for the cytokines analyzed. *Statistically significant difference (P ≤ 0.05) between cells primed in the same environment and then transferred into LCMV Arm– or Cl 13–infected animals; **P ≤ 0.01.
Figure 3
Figure 3. Reversal of T cell inactivation during persistent viral infection.
(A) SMARTA cells from LCMV Arm– (top panels) or Cl 13–infected (bottom panels) mice were isolated 10 days after infection and pooled separately. The numbers in each flow plot indicate the frequency of SMARTA cells on day 10 after LCMV Arm or Cl 13 infection that produced IFN-γ, TNF-α, and IL-2 prior to culture. SMARTA cells isolated on day 10 or 30 after Arm or Cl 13 virus infection were analyzed directly ex vivo or were sorted and cultured for 4 days. The bars in each graph indicate the percentage of IFN-γ–, TNF-α–, and IL-2–producing SMARTA cells prior to the ex vivo culture and following the 4-day culture. The individual bars indicate the frequency of SMARTA cells during LCMV Cl 13 infection that produce each cytokine represented as a percentage of SMARTA cells that produced the same cytokine during LCMV Arm infection. Each group contained cells pooled (prior to sorting) from 2–3 spleens, and the data are representative of at least 2 repeat experiments. (B) The ability of P14 cells (isolated from the same animals as represented in A) to produce IFN-γ, TNF-α, and IL-2 on day 10 after LCMV Arm or Cl 13 infection is shown in the dot plots, and the graphs illustrate the pre- (gray bars) and post-culture (black bars) levels of cytokine-producing P14 cells from LCMV Cl 13–infected animals represented as a percentage of the P14 response observed during LCMV Arm infection.
Figure 4
Figure 4. Decreased infection of DCs and long-term control of viral replication following early antiviral therapy.
(A) Serum viral titers were determined on the indicated days from LCMV Arm– or Cl 13–infected mice that were either left untreated or treated on days 1–8 with ribavirin (Rb). Data are expressed as plaque-forming units per milliliter of serum. The dashed line indicates the lower limit of detection (250 PFU/ml serum). Each circle represents a single animal. *Statistically significant difference of P < 0.03. (B) Splenic DCs, B cells, and macrophages were sorted on day 9 from LCMV Cl 13–infected animals that were either left untreated (gray bars) or treated with ribavirin (black bars). The frequency of cells producing infectious virus in each sorted population was determined by an infectious center assay. Data represent 2 experiments containing pools from 4 mice per group. Tx, treatment.
Figure 5
Figure 5. Therapeutically decreasing viral loads prevents CD4+ T cell inactivation but only minimally preserves CD8+ T cell function.
(A and B) The ability of SMARTA (A) and P14 (B) cells from untreated (gray bars) or ribavirin-treated (black bars) animals to produce IFN-γ, TNF-α, and IL-2 was determined on day 9 after infection with either LCMV Arm (left 2 bars in each graph) or Cl 13 (right 2 bars in each graph). The top graphs of each figure represent the frequency of cytokine-producing SMARTA (A) or P14 (B) cells. The bottom graphs of each figure represent the absolute number of SMARTA (A) or P14 (B) cells and the total number of cytokine-producing SMARTA or P14 cells. The bars represent the average ± SD of 4 mice in each group in 3 independent experiments. Note that the scales on the y axis differ for the cytokines analyzed. *Statistically significant increase (P < 0.05) between the untreated and ribavirin-treated animals; **P ≤ 0.01.
Figure 6
Figure 6. Decreasing viral replication increases CD4+ T cell stimulation and costimulatory molecule expression by APCs.
(AC) On day 9 after infection, splenocytes were isolated from mice infected with LCMV Cl 13 and either left untreated (Cl 13) or treated with ribavirin (Cl 13 + Rb). DCs (A), B cells (B), or macrophages (C) were then sorted and cultured separately with CFSE-labeled naive SMARTA, or P14 cells. No exogenous peptide was added to the cultures. Histograms show gating on SMARTA (left histograms) and P14 (right histograms) cells and illustrate CFSE dilution 3 days after culture. The number in each histogram represents the percentage of cells in each culture that divided. The MFI of the indicated costimulatory molecules on DCs (A), B cells (B), and macrophages (C) from untreated (gray bars) and ribavirin-treated (black bars) Cl 13–infected animals was determined on day 9 after infection. These data represent 2 experiments containing 4 mice per group. PD-L1, programmed death ligand; OX40L, OX40 ligand (CD134); 4-1BBL, 41BB ligand (CD137L); ICOSL, inducible costimulatory molecule ligand. *P < 0.05; **P < 0.01.

Similar articles

Cited by

References

    1. Wherry E.J., Blattman J.N., Murali-Krishna K., van der Most R., Ahmed R. Viral persistence alters CD8 T-cell immunodominance and tissue distribution and results in distinct stages of functional impairment. J. Virol. 2003;77:4911–4927. - PMC - PubMed
    1. Brooks D.G., Teyton L., Oldstone M.B., McGavern D.B. Intrinsic functional dysregulation of CD4 T cells occurs rapidly following persistent viral infection. J. Virol. 2005;79:10514–10527. - PMC - PubMed
    1. Ciurea A., Hunziker L., Klenerman P., Hengartner H., Zinkernagel R.M. Impairment of CD4(+) T cell responses during chronic virus infection prevents neutralizing antibody responses against virus escape mutants. J. Exp. Med. 2001;193:297–305. - PMC - PubMed
    1. Zajac A.J., et al. Viral immune evasion due to persistence of activated T cells without effector function. J. Exp. Med. 1998;188:2205–2213. - PMC - PubMed
    1. Lichterfeld M., et al. Loss of HIV-1-specific CD8+ T cell proliferation after acute HIV-1 infection and restoration by vaccine-induced HIV-1-specific CD4+ T cells. J. Exp. Med. 2004;200:701–712. - PMC - PubMed

Publication types

MeSH terms