

Gamma interferon plays a crucial early antiviral role in protection against West Nile virus infection
- PMID: 16699014
- PMCID: PMC1472130
- DOI: 10.1128/JVI.00274-06
Gamma interferon plays a crucial early antiviral role in protection against West Nile virus infection
Abstract
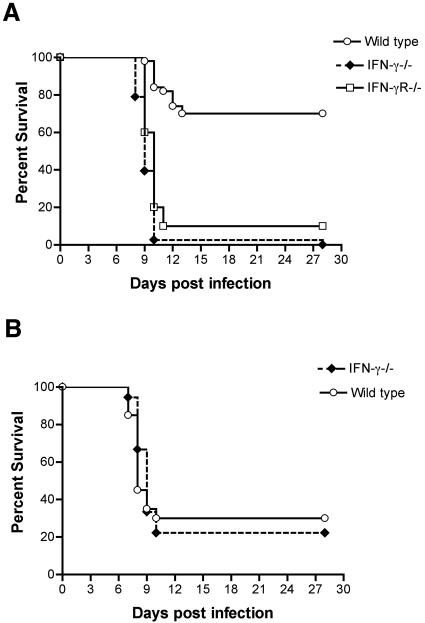
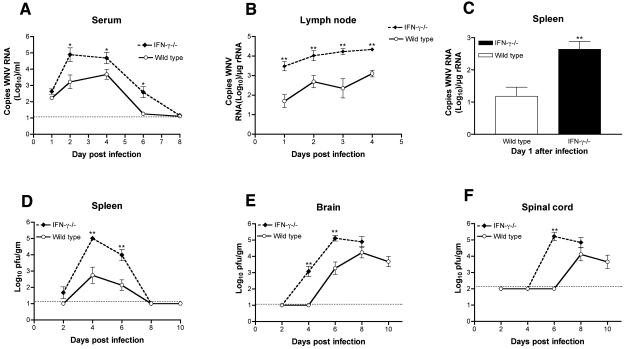
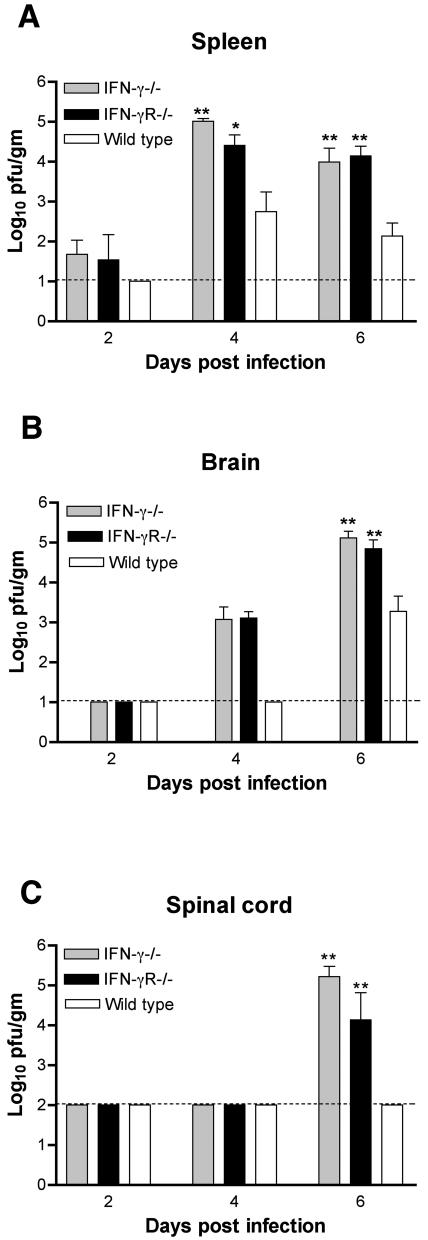
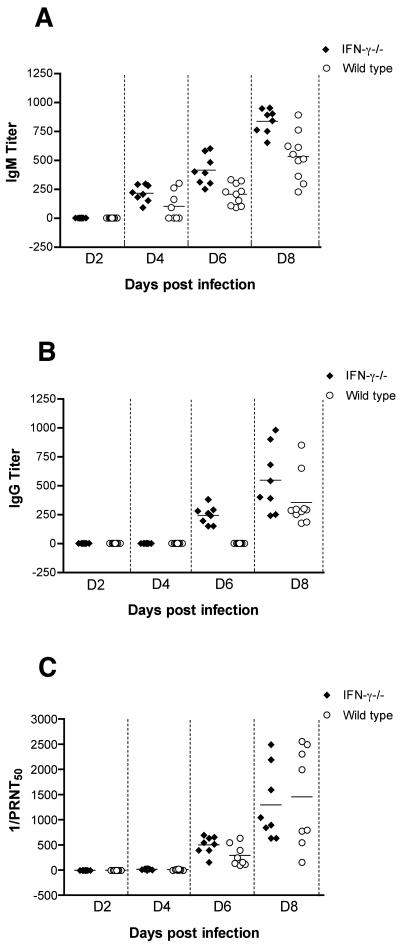
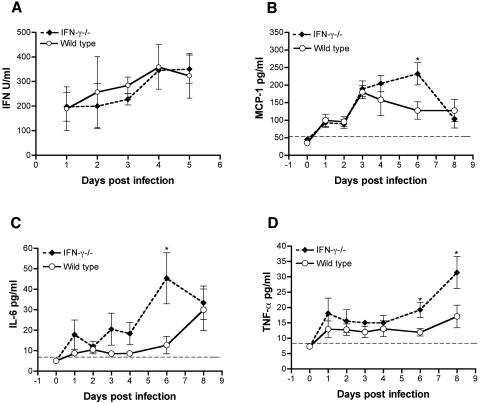
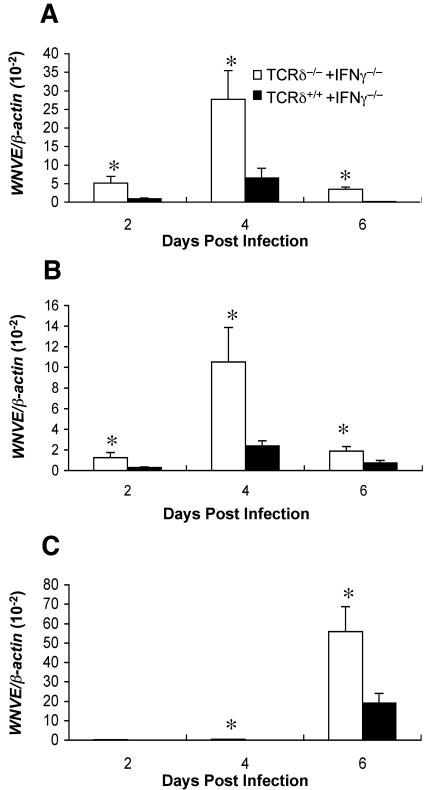
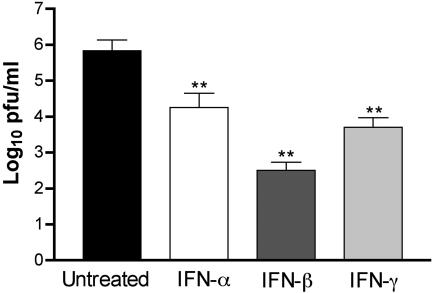
West Nile virus (WNV) causes a severe central nervous system (CNS) infection in humans, primarily in the elderly and immunocompromised. Prior studies have established an essential protective role of several innate immune response elements, including alpha/beta interferon (IFN-alpha/beta), immunoglobulin M, gammadelta T cells, and complement against WNV infection. In this study, we demonstrate that a lack of IFN-gamma production or signaling results in increased vulnerability to lethal WNV infection by a subcutaneous route in mice, with a rise in mortality from 30% (wild-type mice) to 90% (IFN-gamma(-/-) or IFN-gammaR(-/-) mice) and a decrease in the average survival time. This survival pattern in IFN-gamma(-/-) and IFN-gammaR(-/-) mice correlated with higher viremia and greater viral replication in lymphoid tissues. The increase in peripheral infection led to early CNS seeding since infectious WNV was detected several days earlier in the brains and spinal cords of IFN-gamma(-/-) or IFN-gammaR(-/-) mice. Bone marrow reconstitution experiments showed that gammadelta T cells require IFN-gamma to limit dissemination by WNV. Moreover, treatment of primary dendritic cells with IFN-gamma reduced WNV production by 130-fold. Collectively, our experiments suggest that the dominant protective role of IFN-gamma against WNV is antiviral in nature, occurs in peripheral lymphoid tissues, and prevents viral dissemination to the CNS.
Figures
Similar articles
-
Interferon regulatory factor IRF-7 induces the antiviral alpha interferon response and protects against lethal West Nile virus infection.J Virol. 2008 Sep;82(17):8465-75. doi: 10.1128/JVI.00918-08. Epub 2008 Jun 18. J Virol. 2008. PMID: 18562536 Free PMC article.
-
A single amino acid substitution in the West Nile virus nonstructural protein NS2A disables its ability to inhibit alpha/beta interferon induction and attenuates virus virulence in mice.J Virol. 2006 Mar;80(5):2396-404. doi: 10.1128/JVI.80.5.2396-2404.2006. J Virol. 2006. PMID: 16474146 Free PMC article.
-
Alpha/beta interferon protects against lethal West Nile virus infection by restricting cellular tropism and enhancing neuronal survival.J Virol. 2005 Nov;79(21):13350-61. doi: 10.1128/JVI.79.21.13350-13361.2005. J Virol. 2005. PMID: 16227257 Free PMC article.
-
Measure and countermeasure: type I IFN (IFN-alpha/beta) antiviral response against West Nile virus.J Innate Immun. 2009;1(5):435-45. doi: 10.1159/000226248. Epub 2009 Jun 24. J Innate Immun. 2009. PMID: 20375601 Free PMC article. Review.
-
Innate and adaptive immune responses determine protection against disseminated infection by West Nile encephalitis virus.Viral Immunol. 2003;16(3):259-78. doi: 10.1089/088282403322396082. Viral Immunol. 2003. PMID: 14583143 Review.
Cited by
-
Pathogenicity and virulence of West Nile virus revisited eight decades after its first isolation.Virulence. 2021 Dec;12(1):1145-1173. doi: 10.1080/21505594.2021.1908740. Virulence. 2021. PMID: 33843445 Free PMC article.
-
Of Mice and Men: Protective and Pathogenic Immune Responses to West Nile virus Infection.Curr Trop Med Rep. 2015 Mar 1;2(1):41-48. doi: 10.1007/s40475-015-0040-4. Curr Trop Med Rep. 2015. PMID: 26120511 Free PMC article.
-
Blockage of indoleamine 2,3-dioxygenase regulates Japanese encephalitis via enhancement of type I/II IFN innate and adaptive T-cell responses.J Neuroinflammation. 2016 Apr 18;13(1):79. doi: 10.1186/s12974-016-0551-5. J Neuroinflammation. 2016. PMID: 27090635 Free PMC article.
-
Persistent West Nile virus associated with a neurological sequela in hamsters identified by motor unit number estimation.J Virol. 2009 May;83(9):4251-61. doi: 10.1128/JVI.00017-09. Epub 2009 Feb 18. J Virol. 2009. PMID: 19224990 Free PMC article.
-
In vivo imaging of Zika virus reveals dynamics of viral invasion in immune-sheltered tissues and vertical propagation during pregnancy.Theranostics. 2020 May 16;10(14):6430-6447. doi: 10.7150/thno.43177. eCollection 2020. Theranostics. 2020. PMID: 32483462 Free PMC article.
References
-
- Asnis, D. S., R. Conetta, A. A. Teixeira, G. Waldman, and B. A. Sampson. 2000. The West Nile virus outbreak of 1999 in New York: the Flushing Hospital experience. Clin. Infect. Dis. 30:413-418. - PubMed
-
- Austin, B. A., C. James, R. H. Silverman, and D. J. Carr. 2005. Critical role for the oligoadenylate synthetase/RNase L pathway in response to IFN-beta during acute ocular herpes simplex virus type 1 infection. J. Immunol. 175:1100-1106. - PubMed
-
- Beasley, D. W., L. Li, M. T. Suderman, and A. D. Barrett. 2002. Mouse neuroinvasive phenotype of West Nile virus strains varies depending upon virus genotype. Virology 296:17-23. - PubMed
-
- Ben-Nathan, D., S. Lustig, G. Tam, S. Robinzon, S. Segal, and B. Rager-Zisman. 2003. Prophylactic and therapeutic efficacy of human intravenous immunoglobulin in treating West Nile virus infection in mice. J. Infect. Dis. 188:5-12. - PubMed
-
- Bergmann, C. C., B. Parra, D. R. Hinton, R. Chandran, M. Morrison, and S. A. Stohlman. 2003. Perforin-mediated effector function within the central nervous system requires IFN-γ-mediated MHC up-regulation. J. Immunol. 170:3204-3213. - PubMed
Publication types
MeSH terms
Substances
LinkOut - more resources
Full Text Sources
Medical
