Comparative Study
. 2006 May 15;203(5):1329-42.
doi: 10.1084/jem.20060268. Epub 2006 May 8.

E proteins and Notch signaling cooperate to promote T cell lineage specification and commitment

Affiliations
Comparative Study

E proteins and Notch signaling cooperate to promote T cell lineage specification and commitment

Tomokatsu Ikawa et al. J Exp Med. .

Abstract

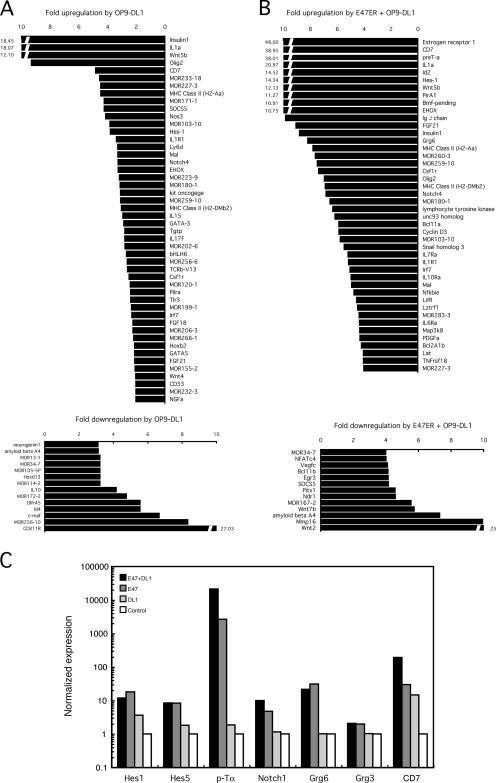
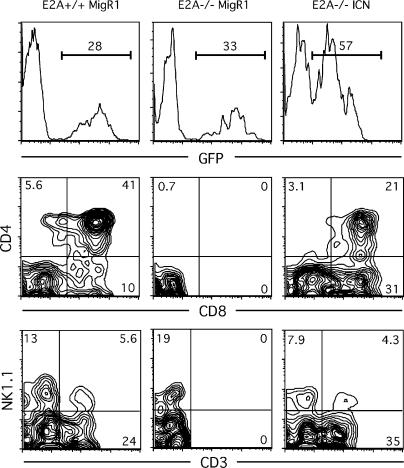
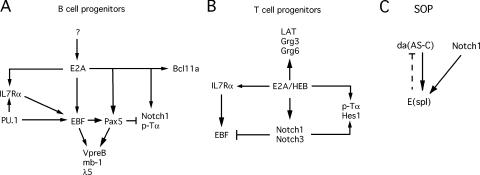
The helix-loop-helix protein, E47, is essential for both B- and T-lineage development. Here we demonstrate that in vitro E47 and Notch signaling act in concert to promote T cell development from fetal hematopoietic progenitors and to restrain development into the natural killer and myeloid cell lineages. The expression of an ensemble of genes associated with Notch signaling is activated by E47, and additionally, Notch signaling and E47 act in parallel pathways to induce a T lineage-specific program of gene expression. Enforced expression of the intracellular domain of Notch rescues the developmental arrest at the T cell commitment stage in E2A-deficient fetal thymocytes. Finally, we demonstrate that regulation of Hes1 expression by Notch signaling and E47 is strikingly similar to that observed during Drosophila melanogaster sensory development. Based on these observations, we propose that in developing fetal thymocytes E47 acts to induce the expression of an ensemble of genes involved in Notch signaling, and that subsequently E47 acts in parallel with Notch signaling to promote T-lineage maturation.


Figures

Figure 1.
Figure 1.
E47 target genes expressed in E2A-deficient hematopoietic progenitor cells. (A) E47ER and bHLHER retroviral constructs. The genes encoding E47 and human CD25 are shown. (B) Protocol used for enforced overexpression of E47 in E2A-deficient HPCs. (C) Target genes activated (left) or repressed (right) by the overexpression of E47. Values indicated on the horizontal axis show the fold induction or repression of E47 target transcript levels. Only changes of more than twofold for the repression and fourfold for the induction are indicated.
Figure 2.
Figure 2.
E47 directly activates in E2A-deficient hematopoietic progenitor cells the expression of genes involved in Notch-mediated signaling. (A) Protocol used to examine regulation of target genes in E2A-deficient HPCs by E47. (B) pTα, IL-7Rα, and LAT mRNA levels in cells either transduced with E47ER or with bHLHER fusion protein. Transcript levels were determined using real-time PCR. Shown is the ratio of transcript levels of E47ER compared with the bHLHER normalized by the acidic ribosomal protein (ARP) mRNA expression. (C) E47 directly regulates pTα, LAT, and IL-7Rα in E2A-deficient HPCs. E2A-deficient cells were treated for a 6-h period in the presence of 4-OHT and CHX. Transcript levels were measured using real-time PCR. Indicated is the fold induction normalized to the ARP. (D) E47 activates the expression of a subset of genes involved in Notch-mediated signaling. Transcript levels were determined by real-time PCR. Shown is the ratio of transcript levels of E47ER compared with bHLHER normalized to the ARP. (E) E47 directly activates the expression of a subset of genes involved in Notch-mediated signaling. E2A-deficient cells were treated for a 6-h period in the presence of 4-OHT and CHX. Transcript levels were measured using real-time PCR. Indicated is the normalized fold induction. (F) E47 induces the expression of Notch-associated genes. E47 instead of E47ER fusion protein is transduced in E2A-deficient cells. Transcript levels were analyzed by real-time PCR after 24 h of infection. (G) E47 directly regulates the expression of Notch-associated genes independent of Notch-mediated signaling. E2A-deficient cells transduced with E47ER were induced with 4OHT and CHX for 6 h in the presence of γ-secretase inhibitor IX. Transcript levels were analyzed by real-time PCR and normalized to ARP mRNA levels. (H) Transcript levels of pTα, IL-7Rα, and LAT in E2A+/+, E2A+/−, and E2A−/− cells derived from fetal day 15 thymocytes. Transcript levels were analyzed by real-time PCR and normalized versus ARP. Black bars represent mRNA levels in E2A-deficient thymocytes. Gray bars represent mRNA levels in E2A+/− thymocytes. White bars represent mRNA levels in wild-type thymocytes. (G) Transcript levels of Hes1, Hes5, Notch1, and Notch3 in E2A+/+, E2A+/−, and E2A−/− thymocytes. RNA was isolated from day 15 fetal thymocytes. Transcript levels were analyzed by real-time PCR and normalized versus ARP. mRNA levels in E2A-deficient (black bars), E2A+/− (gray bars), and wild-type (white bars) thymocytes are shown.
Figure 3.
Figure 3.
E2A proteins bind to highly conserved E-box sites present in a highly conserved Hes1 regulatory element. (A) Alignment of human, mouse, rat, and chicken sequences surrounding the Hes1 locus. Vertical axis indicates over 50% homology compared with the human DNA sequence. Horizontal axis shows where homology is >50%. Four regions of substantial homology with chicken DNA sequence is shown, designated as CR1-CR4. Bottom panel shows the murine and human DNA sequences of the CR3 region. Identical nucleotides are indicated in gray. E-box sites are underlined. (B) DNA sequences of wild-type and mutant Hes-responsive elements used in transactivation studies are shown. (C) Normalized relative luciferase units of activity (RLU) using a dual luciferase reporter assay in E2A-deficient HPCs transfected with either vector alone or expressing E47. Constructs with the mutations in the E-box sites are indicated. (D) In vivo occupancy of the E-box sites in the Hes1 CR3 region in DN and DP thymocytes derived from wild-type and mice carrying an E2A–GFP fusion protein. Input DNA from each preparation is shown. An anti-GFP antibody was used to immunoprecipitate DNA fragments lysed DN and DP cells. DNA samples were serially diluted threefold and examined by PCR using primers flanking the CR3 region. (E) Analysis of E2A binding in vivo to the E-box sites present in the Hes1 CR3 region. Relative levels were determined using real-time PCR of the immunoprecipitated DNA fragments.
Figure 4.
Figure 4.
E47 and Notch signaling act in concert to regulate down-stream target gene expression in E2A-deficient hematopoietic progenitor cells. (A) Target genes activated or repressed in E2A-deficient cells upon exposure to the Notch ligand DL1 for a 6-h period. Values indicated on the horizontal axis show the fold induction (top) or repression (bottom). Only changes of more than threefold are shown. (B) Target genes activated or inhibited in E2A-deficient cells upon exposure to the Notch ligand DL1 and enforced expression of E47 for a 6-h period. Values indicated on the horizontal axis show the fold induction (top) or repression (bottom). Only changes of more than fourfold are shown. (C) E47 and Notch-mediated signaling act in concert to activate pTα gene expression in E2A-deficient progenitor cells. Transcript levels were analyzed by real-time PCR and normalized versus ARP. Black bars represent mRNA levels in E2A-deficient HPCs expressing E47 and exposed to Notch signaling. Dark gray bars represent mRNA levels in E2A-deficient HPCs expressing E47. Light gray bars represent mRNA levels in E2A-deficient HPCs exposed to Notch signaling. White bars represent mRNA levels in E2A-deficient HPCs cultured in the presence of OP9-GFP cells.
Figure 5.
Figure 5.
Rescue of T cell development in E2A-deficient fetal progenitors upon enforced expression of Notch-IC. Lin fetal liver progenitors were transduced with control (MigR1) and Notch-IC (ICN) retroviral vectors and cultured with the deoxyguanosin-treated fetal thymic lobes (C57BL/6) for 17 d. Thymocytes were analyzed by flow cytometry for the expression of GFP, CD4, CD8, CD3, and NK1.1. The numbers in the histograms and quadrants represent the percentage of the cells. The data are representative of three independent experiments.
Figure 6.
Figure 6.
E47 and Notch signaling act in concert to promote T cell development. Lin progenitors (105 cells) derived from E14 E2A+/+, E2A+/−, and E2A−/− fetal livers were cultured on OP9-DL1 cells for 7 d with DMSO alone or in the presence of γ-secretase inhibitor IX at the indicated concentrations. (A) Flow cytometry analysis indicating the expression of CD25 and CD44 of fetal liver cells cultured on OP9-DL1 cells. The percentages of the number of cells present in the various compartments are indicated. (B) Flow cytometry analysis indicating CD19 and NK1.1 expression of cultured cells on OP9-DL1 cells. The percentages of the number of cells present in the quadrants are shown. (C) Total number of NK cells generated from 105 Lin cells of E2A+/+, E2A+/−, and E2A−/− fetal livers cultured for 7 d on OP9-DL1 cells at the indicated concentration of γ-secretase inhibitor. The data are representative of three independent experiments.
Figure 7.
Figure 7.
E47 and Notch signaling act in concert to induce T cell commitment at the expense of myeloid lineage development. Lin progenitors (105 cells) derived from E14 E2A+/+, E2A+/−, and E2A−/− fetal livers were cultured on OP9-DL1 stromal cells for 7 d with DMSO alone or in the presence of γ-secretase inhibitor IX at the indicated concentrations. (A) Flow cytometry analysis indicating the expression of Mac1 and CD19. The percentages of the number of cells present in the various compartments are indicated. (B) Total number of Mac1+ cells generated from 105 Lin cells of E2A+/+, E2A+/−, and E2A−/− fetal livers cultured for 7 d on OP9-DL1 cells at the indicated concentration of γ-secretase inhibitor.
Figure 8.
Figure 8.
Genetic regulatory networks regulating sensory organ and T and B lymphoid lineage developmental progression. Regulatory network controlling specification and commitment of B cell progenitors (A), T cell progenitors (B), and Drosophila melanogaster sensory organ progenitor (SOP) (C) are shown.

Similar articles

Cited by

References

    1. Kondo, M., A.J. Wagers, M.G. Manz, S.S. Prohaska, G.F. Beilhack, J.A. Shimizu, and I.L. Weissman. 2003. Biology of hematopoietic stem cells and progenitors: implications for clinical application. Annu. Rev. Immunol. 21:759–806. - PubMed
    1. Busslinger, M. 2004. Transcriptional control of early B cell development. Annu. Rev. Immunol. 22:55–79. - PubMed
    1. Singh, H., K.L. Medina, and J.M. Pongubala. 2005. Contingent gene regulatory networks and B cell fate specification. Proc. Natl. Acad. Sci. USA. 102:4949–4953. - PMC - PubMed
    1. Pelayo, R., R. Welner, S.S. Perry, J. Huang, Y. Baba, Y. Yokota, and P.W. Kincade. 2005. Lymphoid progenitors and primary routes to becoming cells of the immune system. Curr. Opin. Immunol. 17:100–107. - PubMed
    1. Katsura, Y. 2002. Redefinition of lymphoid progenitors. Nat. Rev. Immunol. 2:127–132. - PubMed

Publication types

MeSH terms

Substances