. 2006 Jun 9;98(11):1381-9.
doi: 10.1161/01.RES.0000225284.36490.a2. Epub 2006 May 4.

A sphingosine-1-phosphate-activated calcium channel controlling vascular smooth muscle cell motility

Affiliations

A sphingosine-1-phosphate-activated calcium channel controlling vascular smooth muscle cell motility

Shang-Zhong Xu et al. Circ Res. .

Abstract

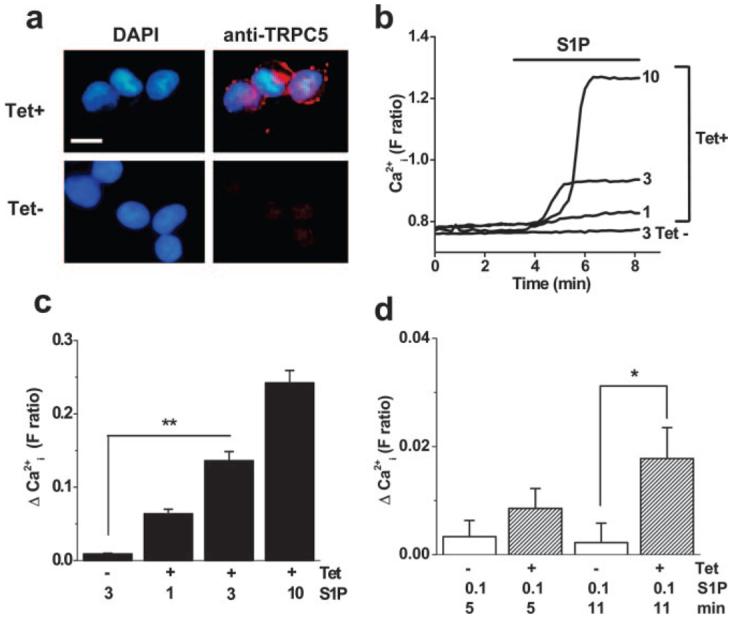
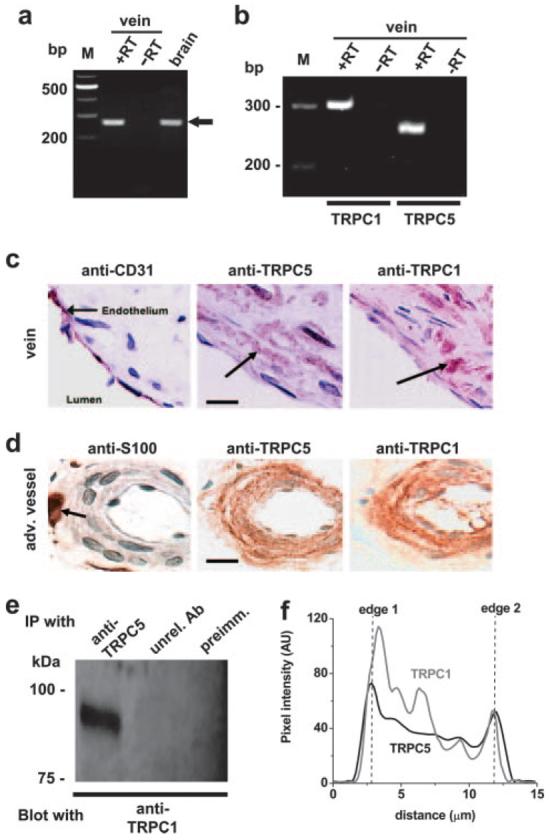
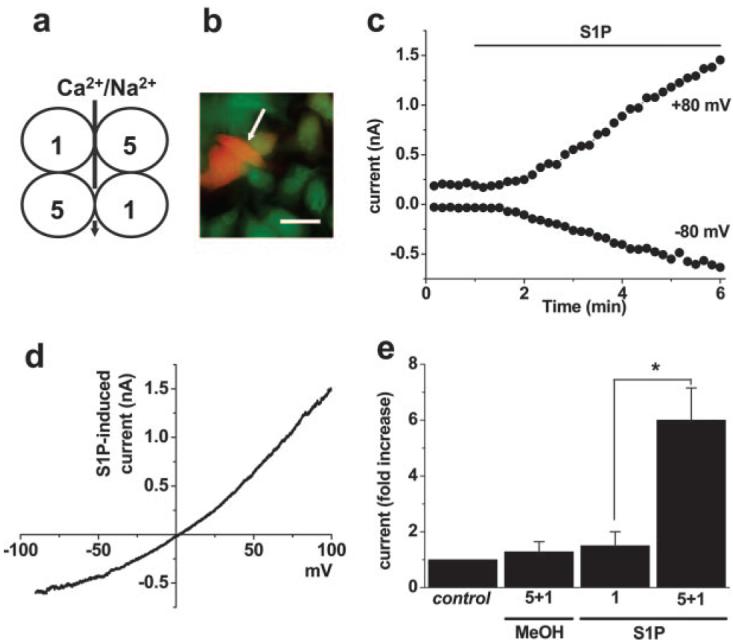
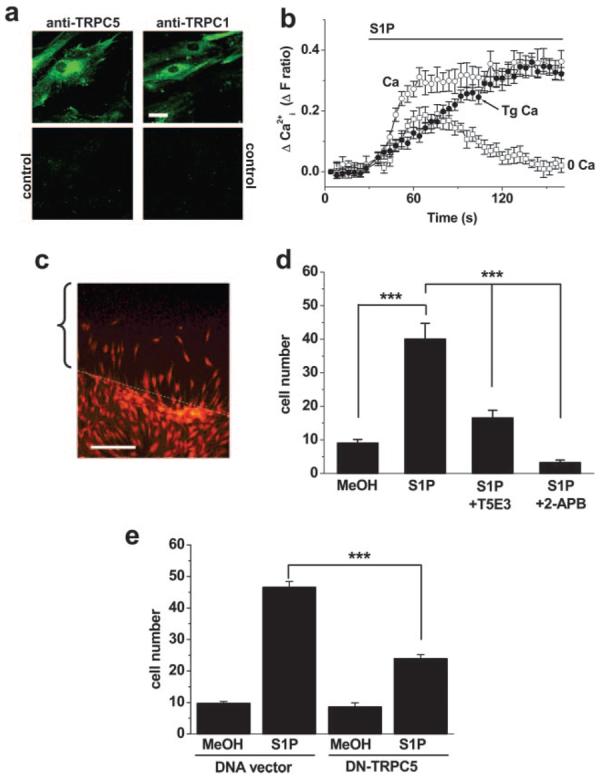
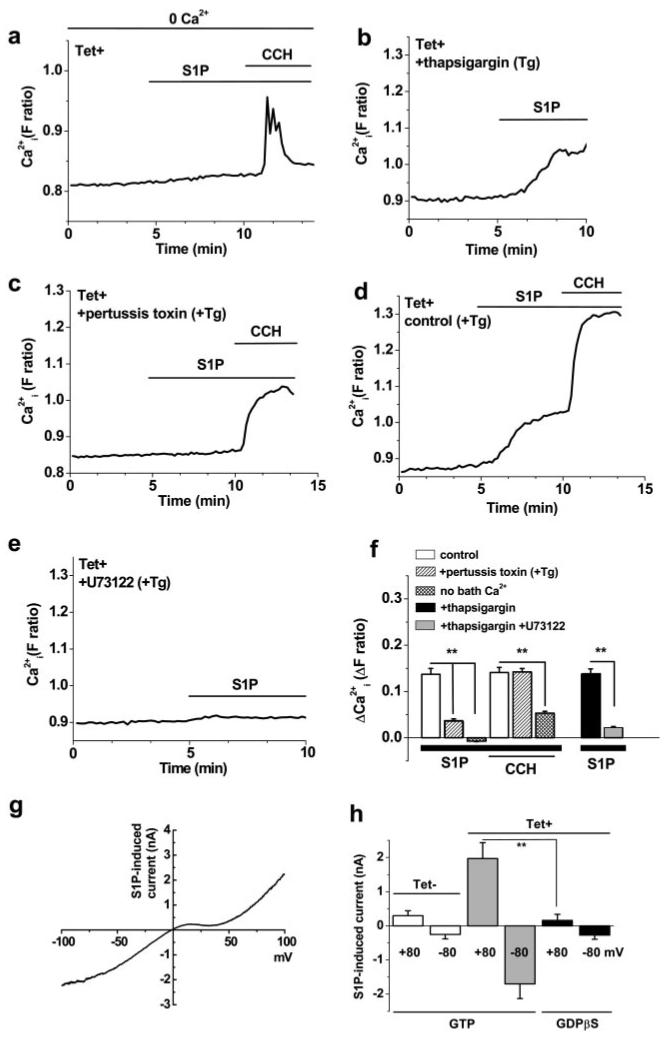
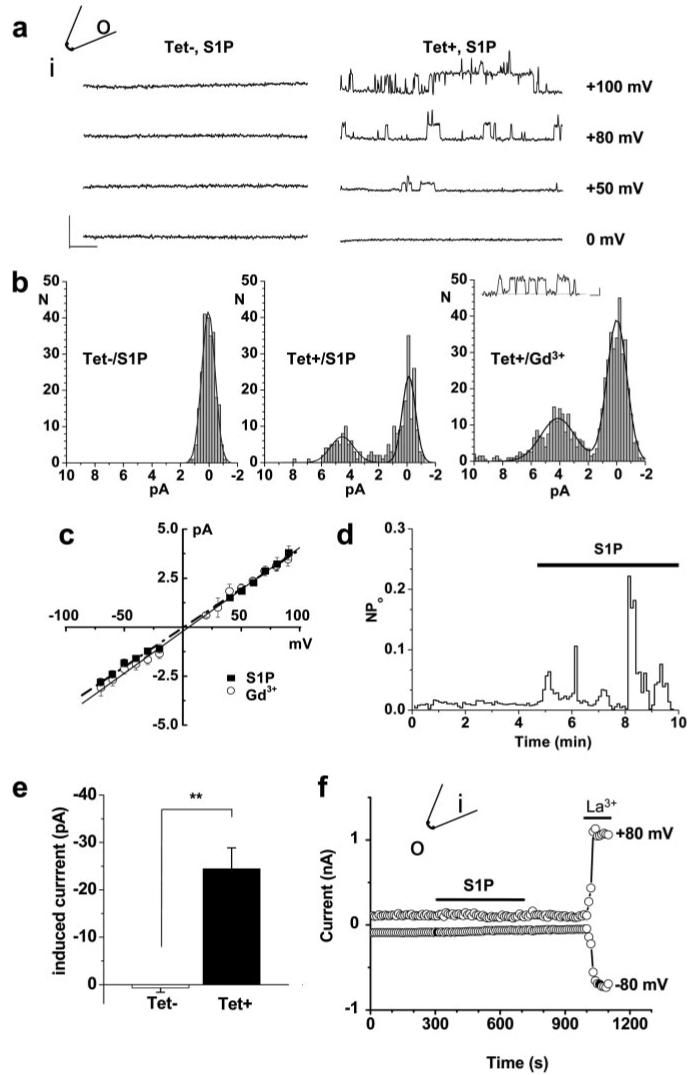
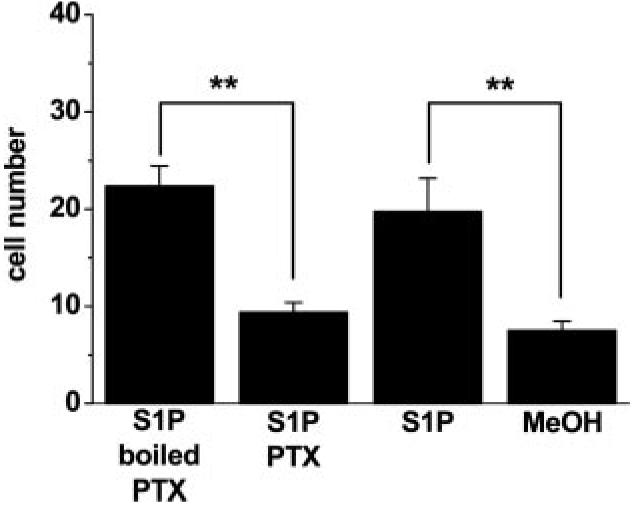
In a screen of potential lipid regulators of transient receptor potential (TRP) channels, we identified sphingosine-1-phosphate (S1P) as an activator of TRPC5. We explored the relevance to vascular biology because S1P is a key cardiovascular signaling molecule. TRPC5 is expressed in smooth muscle cells of human vein along with TRPC1, which forms a complex with TRPC5. Importantly, S1P also activates the TRPC5-TRPC1 heteromultimeric channel. Because TRPC channels are linked to neuronal growth cone extension, we considered a related concept for smooth muscle. We find S1P stimulates smooth muscle cell motility, and that this is inhibited by E3-targeted anti-TRPC5 antibody. Ion permeation involving TRPC5 is crucial because S1P-evoked motility is also suppressed by the channel blocker 2-aminoethoxydiphenyl borate or a TRPC5 ion-pore mutant. S1P acts on TRPC5 via two mechanisms, one extracellular and one intracellular, consistent with its bipolar signaling functions. The extracellular effect appears to have a primary role in S1P-evoked cell motility. The data suggest S1P sensing by TRPC5 calcium channel is a mechanism contributing to vascular smooth muscle adaptation.


Figures

Figure 1
Figure 1
Identification of S1P as a novel activator of human TRPC5. a, Tetracycline-inducible expression of human TRPC5 in HEK 293 cells. T5C3 antibody detected (red labeling) TRPC5 in induced (Tet+) but not control (Tet−) cells. Cell nuclei were counterstained with 4′,6-diamidino-2-phenylindole DAPI (blue). For clarity, the Tet− anti-TRPC5 stain is shown without the DAPI overlay. Bar=10 μm. b, Typical single cell responses to S1P at 1, 3, and 10 μmol/L in cells expressing TRPC5 (Tet+). Control cell (Tet−) failed to respond to 3 μmol/L S1P. c, As in b, but mean data as the change in Ca2+ indicator fluorescence ratio from the baseline. d, Mean data for responses 5 and 11 minutes after starting the application of 0.1 μmol/L S1P.
Figure 2
Figure 2
Endogenous TRPC expression in human saphenous vein smooth muscle cells. a, RT-PCR products based on TRPC5-specific primer set (i). Lanes show products for total RNA from human saphenous vein compared with (+RT) and without (−RT) reverse transcription (RT). M indicates marker DNA. A parallel reaction is shown for human brain RNA (brain; +RT). The expected TRPC5 amplicon is 275 bp. b, As for a, except showing coexpression of TRPC1 and TRPC5-encoding mRNA species in a single medial layer saphenous vein sample and using TRPC5-specific primer set (ii). Predicted amplicon sizes are 303 bp (TRPC1) and 258 bp (TRPC5). c and d, Images of different aspects of human saphenous vein labeled with antibodies (red-brown) and having nuclei counterstained with hematoxylin (blue-purple). Bars=20 μm. c, Showing the endothelial layer of the vein and adjacent subendothelial smooth muscle cells (arrows). Staining was with anti-CD31 (endothelial marker), anti-TRPC5 (T5C3), or anti-TRPC1 (T1E3) antibody. d, Periadventitial vasa vasorum stained with antiprotein S100 (neuronal marker), anti-TRPC5 (T5C3), or anti-TRPC1 (T1E3) antibody. Arrow, perivascular nerve. e, Western blot showing IP result from vein. The IP used anti-TRPC5 antibody (T5C2), unrelated antiserum (unrel. Ab), or preimmune serum as controls. The blot was probed with anti-TRPC1 (T1E3) antibody, revealing protein with the mass predicted for TRPC1 (≈90 kDa). f, Cross-sectional intensity profile for a typical smooth muscle cell freshly isolated from saphenous vein, fixed, permeabilized, and colabeled with antibodies to TRPC5 (T5Chk/Cy3) and TRPC1 (T1E3/fluorescein isothiocyanate). Peaks of fluorescence intensity occur for TRPC5 and TRPC1 at both edges of the cell. AU indicates arbitrary units.
Figure 3
Figure 3
Activation of the TRPC5–TRPC1 heteromultimer. a, Schematic illustrating a plan view of a presumed heterotetrameric arrangement of TRPC1 (1) and TRPC5 (5) with ion permeation through the central pore. b, Example image showing transfection of some Tet+ HEK 293 cells with cDNA encoding TRPC1 and (E)YFP (orange color, white arrow). To reveal all cells, they were loaded with fura-2 indicator dye (green) for illustration purposes. Bar=20 μm. c, Whole-cell patch-clamp recording from a cell coexpressing TRPC5 and TRPC1, showing activation of current by 2 μmol/L S1P. d, The I-V for the current induced by S1P in c during a ramp change in voltage from −90 to +100 mV over a 1-s period. Note the lack of inflection in the I-V near 0 mV, which is a characteristic of TRPC5 alone (Figure 5g) but not the TRPC5–TRPC1 heteromultimer., e, As for c, but mean±SEM data (n=3 for each) showing the fold induction of current at −80 mV in response to methanol vehicle (MeOH) or S1P applied to cells expressing TRPC5 and TRPC1 (Tet+ with TRPC1/YFP) or TRPC1 alone (Tet− with TRPC1/YFP). Control was the pre-MeOH/S1P current.
Figure 4
Figure 4
Role in vascular smooth muscle cell motility. a, Cultured human saphenous vein smooth muscle cells labeled with anti-TRPC5 (T5E3) or anti-TRPC1 (T1E3) antibody. The parallel controls were T5E3 preadsorbed to its antigenic peptide or T1E3 boiled for 10 minutes before use. The cells are very flat, so staining is not restricted to the perimeter of the cells. Bar=20 μm. b, For the same batch of cells as a, the change in intracellular Ca2+ evoked by 1 μmol/L S1P in standard bath solution with (Tg Ca) or without (Ca) pretreatment with 1 μmol/L thapsigargin (Tg), or in Ca2+-free bath solution without Tg pretreatment (0 Ca). Each value is for 16 independent wells. c, Image showing the principle of the cell motility assay. Cell nuclei are stained with ethidium bromide (orange/red). The bracket labels the area originally stripped of cells by the pipette tip, and the white dotted line indicates the boundary. In this example, cells had started to repopulate the space. d, From four independent experiments, the mean±SEM number of cells (per 0.3 mm2) repopulating the area 24 hours after changing to 1% serum with methanol vehicle (MeOH; n=36), 1 μmol/L S1P with PBS (n=45), S1P with T5E3 antibody in PBS (n=36), or S1P with 75 μmol/L 2-APB (n=8). e, Cells were transfected with vector lacking or containing DNA encoding DN mutant TRPC5. As in d, cells were counted after exposure to 1 μmol/L S1P or methanol (n=30 to 42). All comparisons were made in parallel on the same batch of cells.
Figure 5
Figure 5
Activation via G-protein signaling. All cells were induced to express human TRPC5 (Tet+), except as indicated in h. S1P and carbachol (CCH) were bath-applied at 3 and 100 μmol/L, respectively. Example traces for single cells are shown. a, Effect of S1P and CCH in the absence of Ca2+ added to the bath solution (0 Ca2+). b through e, Bath Ca2+ (1.5 mmol/L) was present throughout. b, S1P response after pretreatment with 1 μmol/L thapsigargin (Tg) for 0.5 hours, which prevents CCH-evoked Ca2+ release. c, S1P response after preincubation for 4 to 5 hours with 1 μg/mL pertussis toxin and 0.5 hours with 1 μmol/L thapsigargin. d, As for c, but pertussis toxin was omitted. e, S1P response after pretreatment with 10 μmol/L U73122 (and 1 μmol/L thapsigargin) for 0.5 hours. f, Summary data for the experiments described in a through e. g and h, Whole-cell voltage-clamp recordings from cells induced to express TRPC5 (Tet+) or not (Tet−). A 1-s ramp change in voltage from −100 to +100 mV was applied every 10 s from a holding potential of −60 mV. g, I-V determined during the voltage-ramp for current induced by bath-applied 10 μmol/L S1P with 0.1 mmol/L GTP in the patch pipette. h, Mean (n=4 to 5) current amplitudes at the indicated voltages for whole-cell recordings and bath-applied 10 μmol/L S1P; 0.1 mmol/L GTP or 1 mmol/L GDP-β–S was included in the patch pipette solution, as indicated.
Figure 6
Figure 6
Ionotropic receptor for intracellular S1P. Inside-out (a through e) and outside-out (f) excised patch recordings from cells expressing TRPC5 (Tet+), except for the control (Tet−) data indicated in a, b, and e. a, Original traces showing unitary current events in response to bath-applied 3 μmol/L S1P in a patch from a Tet+ but not Tet− cell. The calibration bars are 5 pA (vertical) and 25 ms. b, Amplitude histograms. For the Tet+/Gd3+ data set, the calibration bars for the example trace are 2 pA (vertical) and 5 ms, and Gd3+ (10 μmol/L) was in the patch pipette. c, Mean unitary current sizes for S1P- and Gd3+-evoked single channel events plotted against voltage. Straight lines were fitted, and the mean unitary conductance was 41±1.5 pS (S1P; n=5) and 41.5±1.0 pS (Gd3+; n=6), close to that reported for mouse TRPC5. d, Time-series plot for single channel activity (NPo), showing activation by bath-applied 3 μmol/L S1P. e, Mean current amplitudes for patches from 9 Tet+ and 14 Tet− cells. f, Typical of 3 experiments, outside-out patch recording showing the lack of effect of S1P but effect of 50 μmol/L lanthanum (La3+).
Figure 7
Figure 7
Effect of pertussis toxin (PTX) on S1P-evoked motility. As for Figure 4d, but showing parallel experiments comparing methanol vehicle (MeOH; n=4), 1 μmol/L S1P (n=4), and 1 μmol/L S1P after pretreatment with 1 μg/mL PTX (n=8) or boiled PTX (n=8).

Comment in

Similar articles

Cited by

References

    1. Spiegel S, Milstien S. Sphingosine-1-phosphate: an enigmatic signaling lipid. Nat Rev Mol Cell Biol. 2003;4:397–407. - PubMed
    1. Levade T, Auge N, Veldman RJ, Cuvillier O, Negre-Salvayre A, Salvayre R. Sphingolipid mediators in cardiovascular cell biology and pathology. Circ Res. 2001;89:957–968. - PubMed
    1. Saba JD, Hla T. Point-counterpoint of sphingosine 1-phosphate metabolism. Circ Res. 2004;94:724–734. - PubMed
    1. Alewijnse AE, Peters SL, Michel MC. Cardiovascular effects of sphingosine-1-phosphate and other sphingomyelin metabolites. Br J Pharmacol. 2004;143:666–684. - PMC - PubMed
    1. Jin ZQ, Goetzl EJ, Karliner JS. Sphingosine kinase activation mediates ischemic preconditioning in murine heart. Circulation. 2004;110:1980–1989. - PubMed

Publication types

MeSH terms