. 2006 Jul;17(7):3197-210.
doi: 10.1091/mbc.e05-12-1101. Epub 2006 May 3.

Distinct mechanisms of clathrin-independent endocytosis have unique sphingolipid requirements

Affiliations

Distinct mechanisms of clathrin-independent endocytosis have unique sphingolipid requirements

Zhi-Jie Cheng et al. Mol Biol Cell. 2006 Jul.

Abstract

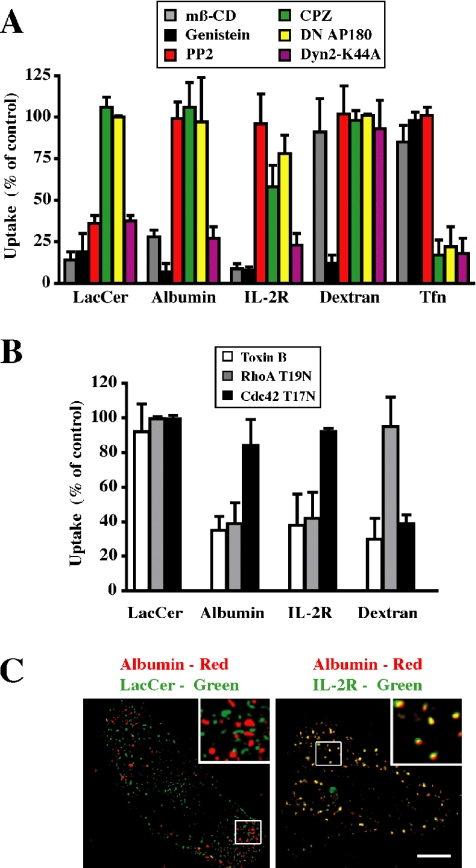
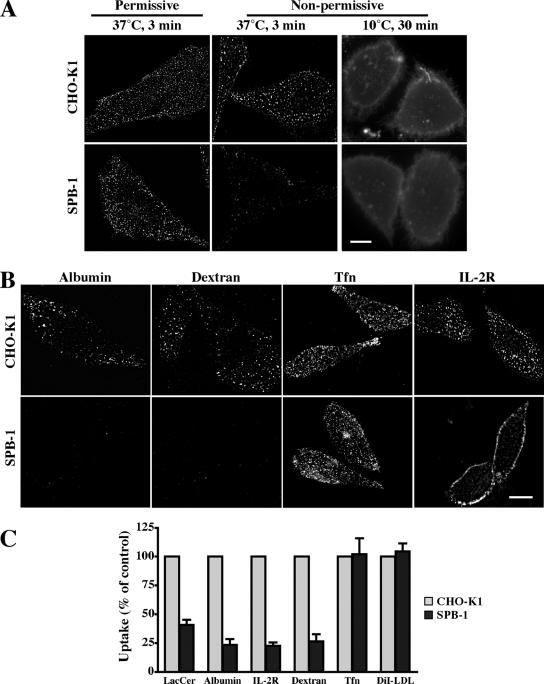
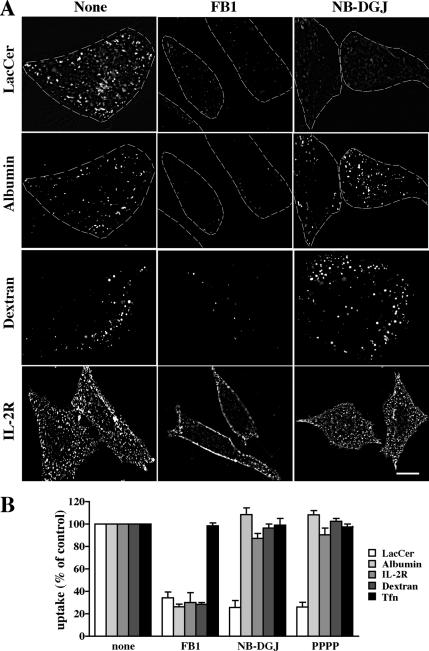
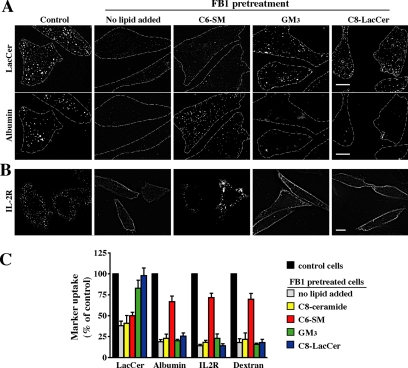
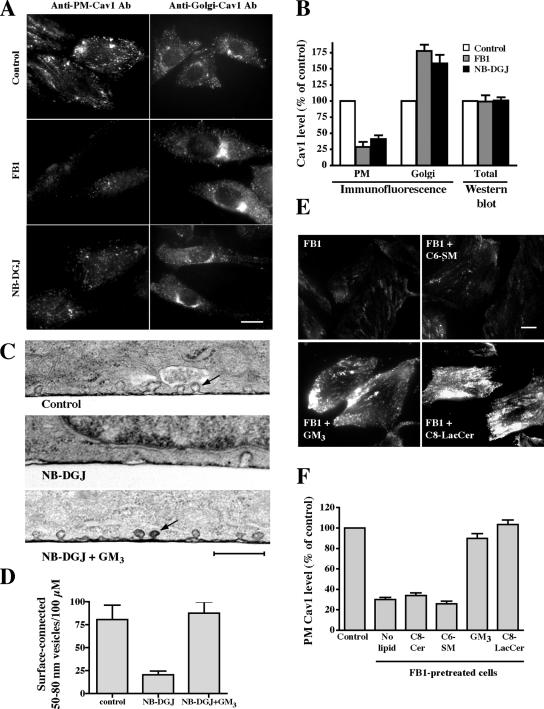
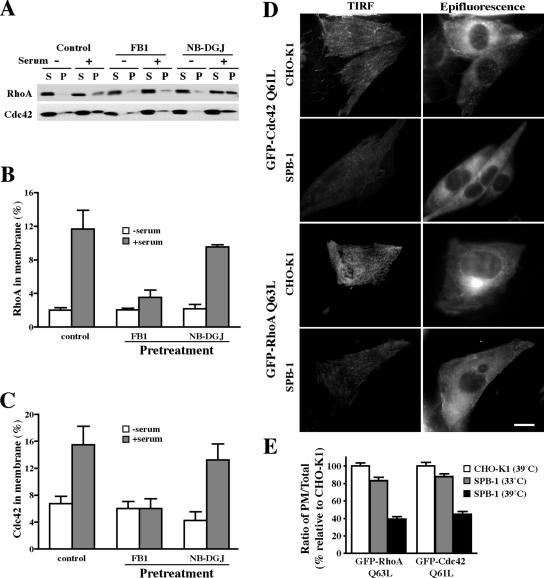
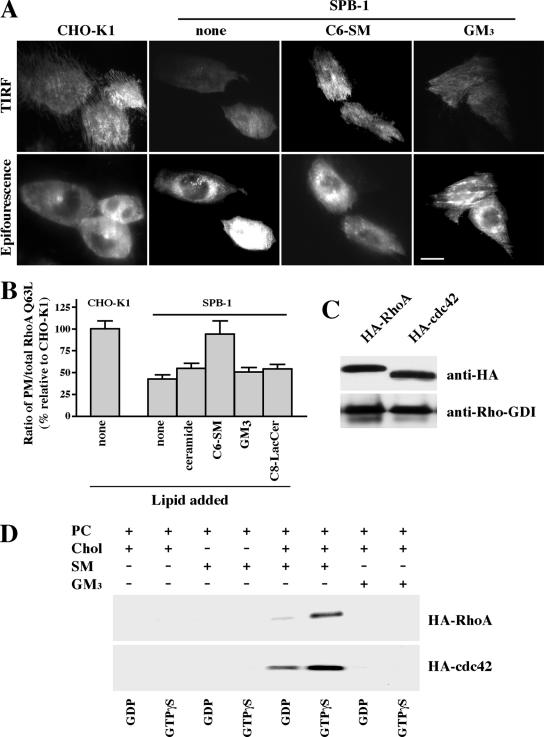
Sphingolipids (SLs) play important roles in membrane structure and cell function. Here, we examine the SL requirements of various endocytic mechanisms using a mutant cell line and pharmacological inhibitors to disrupt SL biosynthesis. First, we demonstrated that in Chinese hamster ovary cells we could distinguish three distinct mechanisms of clathrin-independent endocytosis (caveolar, RhoA, and Cdc42 dependent) which differed in cargo, sensitivity to pharmacological agents, and dominant negative proteins. General depletion of SLs inhibited endocytosis by each clathrin-independent mechanism, whereas clathrin-dependent uptake was unaffected. Depletion of glycosphingolipids (GSLs; a subgroup of SLs) selectively blocked caveolar endocytosis and decreased caveolin-1 and caveolae at the plasma membrane. Caveolar endocytosis and PM caveolae could be restored in GSL-depleted cells by acute addition of exogenous GSLs. Disruption of RhoA- and Cdc42-regulated endocytosis by SL depletion was shown to be related to decreased targeting of these Rho proteins to the plasma membrane and could be partially restored by exogenous sphingomyelin but not GSLs. Both the in vivo membrane targeting and in vitro binding to artificial lipid vesicles of RhoA and Cdc42 were shown to be dependent upon sphingomyelin. These results provide the first evidence that SLs are differentially required for distinct mechanisms of clathrin-independent endocytosis.


Figures

Figure 1.
Figure 1.
Characterization of the endocytosis of various markers in CHO-K1 cells. (A) Cells were pretreated with mβ-CD, genistein, PP2, or CPZ or cotransfected with CFP-Nuc and DN AP180 or Dyn2 K44A constructs. Internalization (5 min at 37°C) of fluorescently labeled LacCer, albumin, dextran, or Tfn, relative to untreated cells (control) was quantified by image analysis. Internalization of IL-2R was followed after transfection of cells with IL-2R β (see Materials and Methods). (B) Cells were pretreated with toxin B or cotransfected with CFP-Nuc and RhoA T19N or Cdc42 T17N constructs, and internalization (5 min at 37°C) of the indicated marker, relative to that in nontransfected cells, was quantified by image analysis. Values in A and B represent means ± SD (n ≥ 30 from 3 independent experiments). (C) Colocalization of albumin with BODIPY-LacCer versus IL-2R in CHO cells. Cells, untransfected (left) or transfected with IL-2R β (right; see Materials and Methods), were coincubated with AF647-albumin and either BODIPY-LacCer or PE-mik-β3. After internalization for 1 min at 37°C, samples were acid stripped and back exchanged before microscopy. Separate images were acquired for each fluorophore, rendered in pseudocolor, and are presented as overlays. Insets show the boxed regions at higher magnification. Note that LacCer and albumin were not colocalized (presence of discrete green and red puncta) whereas LacCer and IL-2R overlapped extensively as shown by the yellow puncta. Bar, 10 μm.
Figure 2.
Figure 2.
SL depletion selectively attenuates clathrin-independent endocytosis. (A) CHO-K1 or SPB-1 cells were cultured under permissive (F-12 medium containing 5% FBS at 33°C; left) or nonpermissive (Nutridoma-BO medium at 39°C; middle and right) conditions for 48 h. Cells were then incubated for 30 min at 10°C with 1 μM BODIPY-LacCer and immediately observed (right) or warmed for 3 min at 37°C and back exchanged (left, middle) before observation under the fluorescence microscope at green wavelengths. Similar effects were also observed after 5 and 10 min of internalization (Supplemental Figure 5B). (B) CHO-K1 or SPB-1 cells were cultured under nonpermissive conditions for 48 h. Internalization (5 min at 37°C) of the indicated markers was measured as in Figure 1. Bars, 10 μm. (C) Quantitative analysis of the uptake (5 min at 37°C) of the indicated markers in CHO-K1 and SPB-1 cells cultured under nonpermissive conditions. Results for SPB-1 cells are expressed as percentage of uptake measured in CHO-K1 cells. Values are the mean ± SD (n ≥ 50 cells from 3 independent experiments).
Figure 3.
Figure 3.
GSLs are required for caveolar-mediated endocytosis of BODIPY-LacCer. CHO-K1 cells were pretreated with FB1, NB-DGJ, or PPPP for 48 h (see Materials and Methods). The internalization (5 min at 37°C) of BODIPY-LacCer, albumin, dextran, and IL-2R were then observed and quantified as in Figure 1. (A) Representative fluorescence micrographs for control, FB1 or NB-DGJ treated cells. Bar, 10 μm. (B) Quantitation of marker uptake. Results are expressed as percentage of marker uptake in untreated (control) cells. Values are the mean ± SD (n ≥ 50 cells for each marker).
Figure 4.
Figure 4.
Exogenous SLs restore marker uptake in FB1-treated cells. CHO-K1 cells were untreated (control) or pretreated with 20 μg/ml FB1 for 48 h. FB1-treated cells were then incubated with a 20 μM BSA complex of C6-SM, GM3, or C8-LacCer for 30 min at 10°C in HMEM. (A) Cells were then double labeled with BODIPY-LacCer and AF647-albumin for 30 min at 10°C, and the internalization (5 min at 37°C) was then measured as described in Figure 1. Dashed lines delineate cell periphery in each field. Bar, 10 μm. Note that the same fields of cells are shown for LacCer and albumin uptake. (B) Cells were incubated with IL-2R antibody under the same conditions as described in A. Fluorescent regions at the PM indicate noninternalized IL-2R antibody. Bar, 10 μm. (C) Uptake of BODIPY-LacCer, albumin, IL-2R, or dextran in FB1-treated cells after addition of the indicated exogenous SL. Results were quantified by image analysis and are expressed as a percentage of marker uptake in control cells. Values are the mean ± SD (n ≥ 50 cells for each condition).
Figure 5.
Figure 5.
Effect of SL depletion on Cav1 distribution and the number of surface-connected, 50- to 80-nm vesicles at the PM of CHO-K1 cells. Cells were untreated (control) or pretreated with FB1 or NB-DGJ for 2 d. (A) Samples were permeabilized with methanol and stained with anti-PM-Cav1 or permeabilized with 0.1% saponin and stained with anti-Golgi-Cav1 antibodies (Pol et al., 2005). Cells were then incubated with fluorescent secondary antibodies, and staining was observed by fluorescence microscopy. Bar, 10 μm. (B) Samples treated and stained for Cav1 as described in A were analyzed for PM (anti-PM-Cav1-antibody) and Golgi (anti-Golgi-Cav1 antibody) Cav1 signal intensity by microscopy and image analysis. Note that the values shown for “Golgi” represent quantitation of entire cell fluorescence detected with the anti-Golgi-Cav1 antibody (see A). No differences in the total amount of Cav1 were detected by Western blotting of cell lysates from control, FB1-, or NB-DGJ–pretreated cells (B). (C andD) Cells were untreated (control), pretreated with NB-DGJ for 48 h, or pretreated with NB-DGJ for 48 h and then with GM3 ganglioside for 30 min at 10°C. Cells were then stained with ruthenium red to identify surface-connected invaginations, fixed, and processed for transmission EM. Samples were sectioned vertically to the substratum. (D) For quantitation, the entire circumference of a given cell in a single section was analyzed. Values represent the number of 50- to 80-nm surface-connected vesicles within 0.5 μm of the cell surface and are expressed as number per 100 μm of length. In total, 30 different cells were analyzed for each condition in three independent experiments. Note that the NB-DGJ–treated cells showed approximately threefold reduction in the number of these vesicles per unit length. Bar, 500 nm. (E) Cells treated with FB1 were incubated with exogenous lipids for 30 min at 10°C and then fixed and stained for PM-Cav1 immunofluorescence as described in A. Bar, 10 μm. (F) Quantitation of PM labeling in cells treated with FB1 plus exogenous lipids as described in E. Results are means+ SE for ≥30 cells from three independent experiments for each condition shown.
Figure 6.
Figure 6.
SLs modulate the serum-stimulated membrane targeting of Rho GTPases. (A–C) In vitro studies using CHO-K1 cells treated with FB1 or NB-DGJ. (D and E) In situ studies using CHO-K1 and SPB-1 cells. (A) CHO-K1 cells were untreated or pretreated with FB1 or NB-DGJ for 2 d and serum starved overnight. Cells were then stimulated with 10% FBS for 10 min and then lysed in hypotonic buffer. The particulate (P) and soluble (S) fractions were isolated, and 2% of the cytoplasmic fraction and 10% of the membrane fraction were analyzed by Western blotting. (B and C) Densitometric analysis of Rho GTPase translocation to membranes. The percentage of RhoA (B) or Cdc42 (C) in the membrane fraction was calculated accordingly. (D) CHO-K1 and SPB-1 cells transfected with GFP-RhoA Q63L or GFP-Cdc42 Q61L constructs were cultured under nonpermissive conditions for 48 h and then serum starved overnight. The presence of GFP-RhoA Q63L or GFP-Cdc42 Q61L at the PM was observed by TIRF microscopy at 10°C (left). The corresponding cells were also observed by epifluorescence microscopy (right), demonstrating that substantial amounts of GFP fluorescence were present in all the cell samples visualized by TIRF microscopy. Bar, 10 μm. (E) Quantitative analysis of the PM-associated GFP-RhoA or -Cdc42 in CHO-K1 and SPB-1 cells. SPB-1 cells were evaluated after growth under permissive (33°C) or nonpermissive (39°C; SL-depleted) conditions. Values of PM and total cell fluorescence of individual cells were obtained by image analysis of TIRF and epifluorescence micrographs, respectively, acquired under standardized exposure conditions. PM/total cell fluorescence ratios calculated for SBP-1 cells are expressed relative to ratios for CHO-K1 cells, which were arbitrarily set to 100. Results are the mean ± SD from at least 50 measurements for each condition.
Figure 7.
Figure 7.
Translocation of Rho-GTPases to membranes requires SM. (A andB) CHO-K1 and SPB-1 cells transfected with GFP-RhoA Q63L were cultured under nonpermissive conditions for 48 h and then serum starved. The SPB-1 cells were incubated for 30 min at 10°C ± 20 μM C6-SM/BSA or GM3/BSA in HMEM and then observed by TIRF or epifluorescence microscopy at 10°C. Bar, 10 μm. (B) PM-associated GFP-RhoA Q63L fluorescence was quantified relative to total cell fluorescence by image analysis as described in Figure 6E. PM/total cell fluorescence ratios calculated for SBP-1 cells ± lipids are expressed relative to the PM/total ratio in CHO-K1 cells (with no added lipid), which was set to 100. Values are the mean ± SD from ≥50 cells for each condition. (C) CHO-K1 cells were transiently transfected with HA-RhoA or HA-Cdc42. After 48 h, the HA-tagged proteins in the cell lysate were immunoprecipitated using immobilized anti-HA antibody matrix. The immunoprecipitates were analyzed by Western blotting using anti-HA or anti-Rho-GDI antibodies. (D) MLVs were prepared from DMPC/Chol (85/15, mol/mol); DMPC/SM (85/15, mol/mol), DMPC/SM/Chol (42.5/42.5/15, mol/mol/mol), or DMPC/GM3/Chol (42.5/42.5/15, mol/mol/mol) and subsequently incubated with HA-tagged RhoA or Cdc42 in the presence of GDP or GTPγS. After washing the MLVs, binding was determined by SDS-PAGE and Western blotting (see Materials and Methods).

Similar articles

Cited by

References

    1. Andrieu N., Salvayre R., Levade T. Comparative study of the metabolic pools of sphingomyelin and phosphatidylcholine sensitive to tumor necrosis factor. Eur. J. Biochem. 1996;236:738–745. - PubMed
    1. Bain J., McLauchlan H., Elliott M., Cohen P. The specificities of protein kinase inhibitors: an update. Biochem. J. 2003;371:199–204. - PMC - PubMed
    1. Bito R., Hino S., Baba A., Tanaka M., Watabe H., Kawabata H. Degradation of oxidative stress-induced denatured albumin in rat liver endothelial cells. Am. J. Physiol. 2005;289:C531–C542. - PubMed
    1. Brown D. A., London E. Functions of lipid rafts in biological membranes. Annu. Rev. Cell Dev. Biol. 1998;14:111–136. - PubMed
    1. Chen C.-S., Rosenwald A. G., Pagano R. E. Ceramide as a modulator of endocytosis. J. Biol. Chem. 1995;270:13291–13297. - PubMed

Publication types

MeSH terms