Dynamic interaction of TTDA with TFIIH is stabilized by nucleotide excision repair in living cells
- PMID: 16669699
- PMCID: PMC1457016
- DOI: 10.1371/journal.pbio.0040156
Dynamic interaction of TTDA with TFIIH is stabilized by nucleotide excision repair in living cells
Abstract
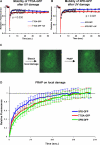
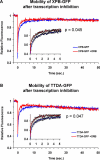
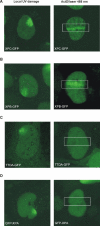
Transcription/repair factor IIH (TFIIH) is essential for RNA polymerase II transcription and nucleotide excision repair (NER). This multi-subunit complex consists of ten polypeptides, including the recently identified small 8-kDa trichothiodystrophy group A (TTDA)/ hTFB5 protein. Patients belonging to the rare neurodevelopmental repair syndrome TTD-A carry inactivating mutations in the TTDA/hTFB5 gene. One of these mutations completely inactivates the protein, whereas other TFIIH genes only tolerate point mutations that do not compromise the essential role in transcription. Nevertheless, the severe NER-deficiency in TTD-A suggests that the TTDA protein is critical for repair. Using a fluorescently tagged and biologically active version of TTDA, we have investigated the involvement of TTDA in repair and transcription in living cells. Under non-challenging conditions, TTDA is present in two distinct kinetic pools: one bound to TFIIH, and a free fraction that shuttles between the cytoplasm and nucleus. After induction of NER-specific DNA lesions, the equilibrium between these two pools dramatically shifts towards a more stable association of TTDA to TFIIH. Modulating transcriptional activity in cells did not induce a similar shift in this equilibrium. Surprisingly, DNA conformations that only provoke an abortive-type of NER reaction do not result into a more stable incorporation of TTDA into TFIIH. These findings identify TTDA as the first TFIIH subunit with a primarily NER-dedicated role in vivo and indicate that its interaction with TFIIH reflects productive NER.
Figures

Comment in
-
A tiny protein plays a big role in DNA repair.PLoS Biol. 2006 Jun;4(6):e184. doi: 10.1371/journal.pbio.0040184. Epub 2006 May 9. PLoS Biol. 2006. PMID: 20076585 Free PMC article. No abstract available.
Similar articles
-
Disruption of TTDA results in complete nucleotide excision repair deficiency and embryonic lethality.PLoS Genet. 2013 Apr;9(4):e1003431. doi: 10.1371/journal.pgen.1003431. Epub 2013 Apr 18. PLoS Genet. 2013. PMID: 23637614 Free PMC article.
-
TTDA: big impact of a small protein.Exp Cell Res. 2014 Nov 15;329(1):61-8. doi: 10.1016/j.yexcr.2014.07.008. Epub 2014 Jul 10. Exp Cell Res. 2014. PMID: 25016283 Review.
-
Slowly progressing nucleotide excision repair in trichothiodystrophy group A patient fibroblasts.Mol Cell Biol. 2011 Sep;31(17):3630-8. doi: 10.1128/MCB.01462-10. Epub 2011 Jul 5. Mol Cell Biol. 2011. PMID: 21730288 Free PMC article.
-
Comparative study of nucleotide excision repair defects between XPD-mutated fibroblasts derived from trichothiodystrophy and xeroderma pigmentosum patients.DNA Repair (Amst). 2008 Dec 1;7(12):1990-8. doi: 10.1016/j.dnarep.2008.08.009. Epub 2008 Oct 10. DNA Repair (Amst). 2008. PMID: 18817897
-
TFIIH central activity in nucleotide excision repair to prevent disease.DNA Repair (Amst). 2023 Dec;132:103568. doi: 10.1016/j.dnarep.2023.103568. Epub 2023 Sep 7. DNA Repair (Amst). 2023. PMID: 37977600 Review.
Cited by
-
Recruitment of the nucleotide excision repair endonuclease XPG to sites of UV-induced dna damage depends on functional TFIIH.Mol Cell Biol. 2006 Dec;26(23):8868-79. doi: 10.1128/MCB.00695-06. Epub 2006 Sep 25. Mol Cell Biol. 2006. PMID: 17000769 Free PMC article.
-
Dissociation of CAK from core TFIIH reveals a functional link between XP-G/CS and the TFIIH disassembly state.PLoS One. 2010 Jun 8;5(6):e11007. doi: 10.1371/journal.pone.0011007. PLoS One. 2010. PMID: 20543986 Free PMC article.
-
XPB and XPD helicases in TFIIH orchestrate DNA duplex opening and damage verification to coordinate repair with transcription and cell cycle via CAK kinase.DNA Repair (Amst). 2011 Jul 15;10(7):697-713. doi: 10.1016/j.dnarep.2011.04.028. Epub 2011 May 14. DNA Repair (Amst). 2011. PMID: 21571596 Free PMC article. Review.
-
Disruption of TTDA results in complete nucleotide excision repair deficiency and embryonic lethality.PLoS Genet. 2013 Apr;9(4):e1003431. doi: 10.1371/journal.pgen.1003431. Epub 2013 Apr 18. PLoS Genet. 2013. PMID: 23637614 Free PMC article.
-
Immune characteristics analysis and construction of a four-gene prognostic signature for lung adenocarcinoma based on estrogen reactivity.BMC Cancer. 2023 Oct 31;23(1):1047. doi: 10.1186/s12885-023-11415-y. BMC Cancer. 2023. PMID: 37907850 Free PMC article.
References
-
- Hoeijmakers JH. Genome maintenance mechanisms for preventing cancer. Nature. 2001;411:366–374. - PubMed
-
- Wood RD, Mitchell M, Sgouros J, Lindahl T. Human DNA repair genes. Science. 2001;291:1284–1289. - PubMed
-
- Hanawalt PC. Subpathways of nucleotide excision repair and their regulation. Oncogene. 2002;21:8949–8956. - PubMed
-
- Sugasawa K, Ng JM, Masutani C, Iwai S, van der Spek PJ, et al. Xeroderma pigmentosum group C protein complex is the initiator of global genome nucleotide excision repair. Mol Cell. 1998;2:223–232. - PubMed
Publication types
MeSH terms
Substances
LinkOut - more resources
Full Text Sources
Medical
Molecular Biology Databases
Research Materials

