. 2006 Jun;9(6):807-15.
doi: 10.1038/nn1688. Epub 2006 Apr 30.

Distinct timing in the activity of cannabinoid-sensitive and cannabinoid-insensitive basket cells

Affiliations

Distinct timing in the activity of cannabinoid-sensitive and cannabinoid-insensitive basket cells

Lindsey L Glickfeld et al. Nat Neurosci. 2006 Jun.

Abstract

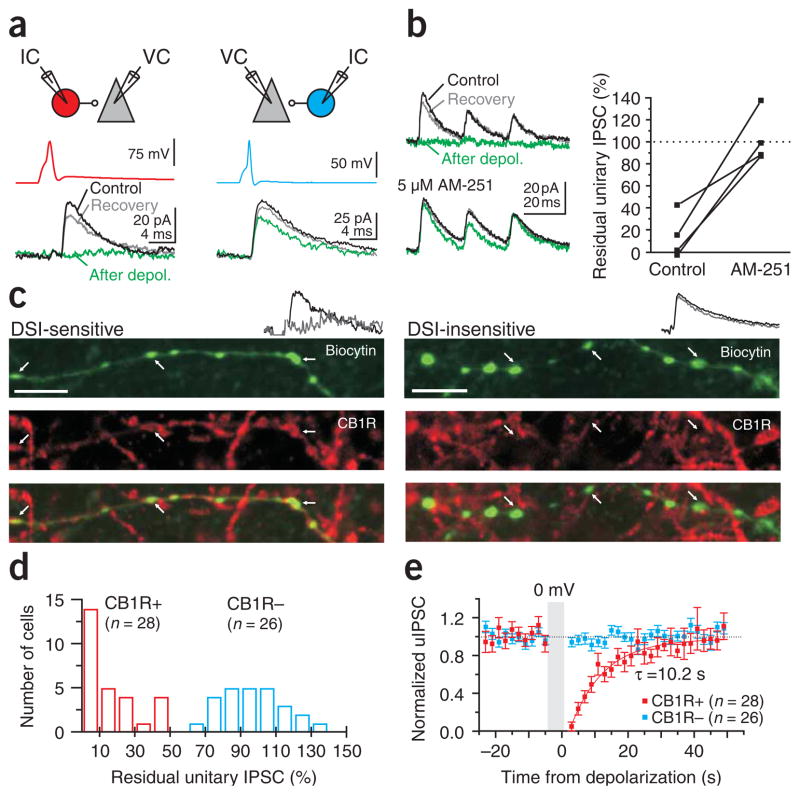
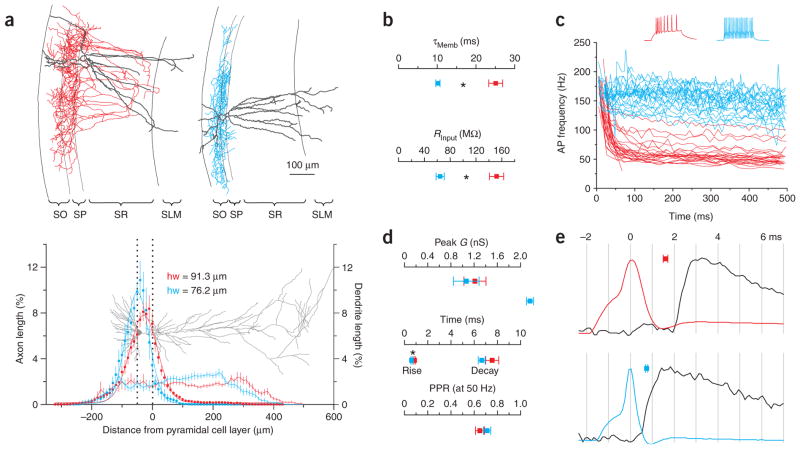
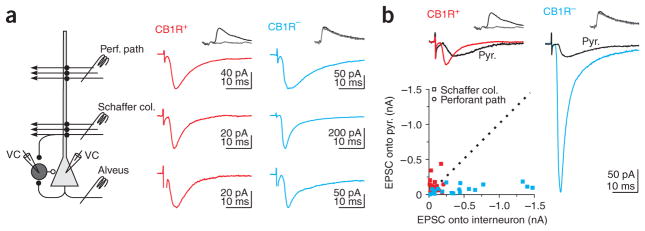
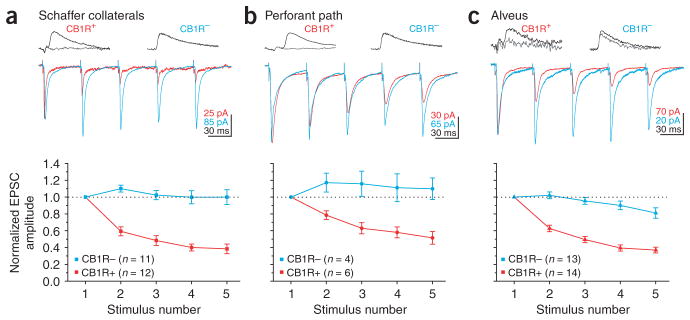
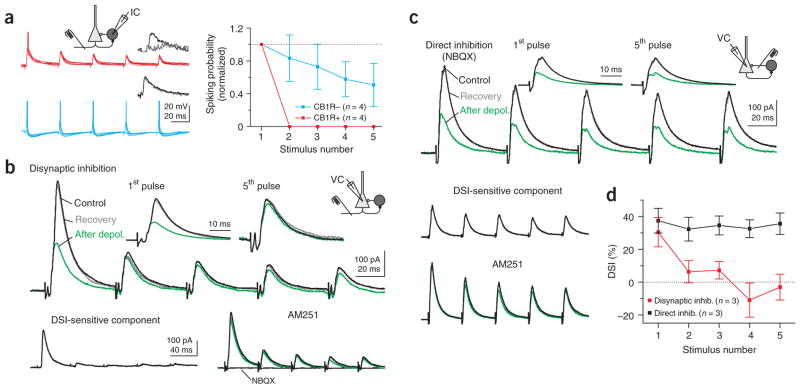
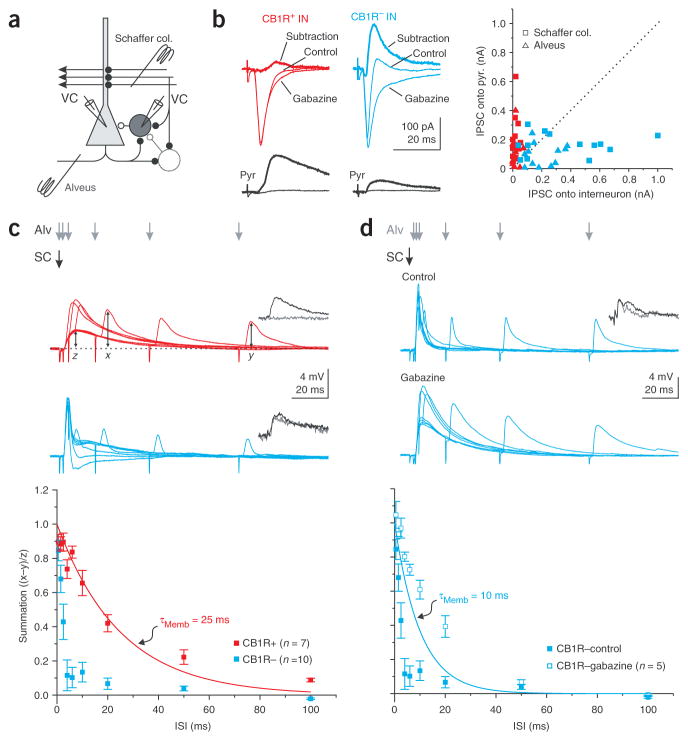
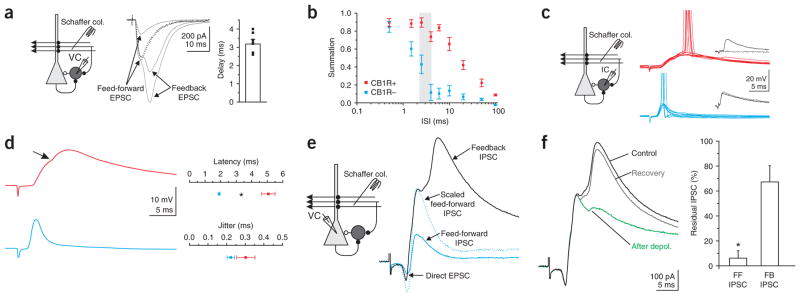
Cannabinoids are powerful modulators of inhibition, yet the precise spike timing of cannabinoid receptor (CB1R)-expressing inhibitory neurons in relation to other neurons in the circuit is poorly understood. Here we found that the spike timing of CB1R-expressing basket cells, a major target for cannabinoids in the rat hippocampus, was distinct from the other main group of basket cells, the CB1R-negative. Despite receiving the same afferent inputs, the synaptic and biophysical properties of the two cell types were tuned to detect different features of activity. CB1R-negative basket cells responded reliably and immediately to subtle and repetitive excitation. In contrast, CB1R-positive basket cells responded later and did not follow repetitive activity, but were better suited to integrate the consecutive excitation of independent afferents. This temporal separation in the activity of the two basket cell types generated distinct epochs of somatic inhibition that were differentially affected by endocannabinoids.


Conflict of interest statement

COMPETING INTERESTS STATEMENT

The authors declare that they have no competing financial interests.

Figures

Figure 1
Figure 1
Identification of CB1R-positive and -negative basket cells. (a) Top, schematic of the recording configuration. IC, current clamp; VC, voltage clamp. Bottom, current and voltage traces. Unitary IPSCs (uIPSCs) recorded in a pyramidal cell (black traces, Vholding = −50 mV) in response to a spike triggered in a presynaptic basket cell (upper traces). Pyramidal cell depolarization (0 mV, 5 s) transiently suppressed the uIPSC (green traces) in some basket cells (left) but not in others (right). (b) Left, suppression of uIPSCs evoked by three action potentials at 50 Hz (upper traces) was abolished by the CB1R antagonist AM 251 (5 μM, lower traces). Right, summary graph (n = 4). (c) Biocytin-filled axons (top), CB1R antibodies (middle) and their superposition (bottom) in DSI-sensitive (left) and -insensitive (right) basket cells. White arrows, boutons of the recorded interneuron. Scale bar, 5 μm. Note the colocalization of biocytin and CB1R in the DSI-sensitive basket cell. Inset (in all figures), current traces illustrating the presence or absence of DSI on the uIPSC in the recorded basket-to–pyramidal cell pair. Black trace, control. Gray trace, after depolarization. (d) Distribution of the uIPSC amplitudes after depolarization (54 pairs). Suppression, red bars (n = 28). Lack of suppression, blue bars (n = 26). The amplitude of the residual IPSC is the average of the uIPSCs collected 3 s and 5 s after the end of the depolarization (and hence shows a variable degree of recovery). (e) Summary (mean ± s.e.m.) of the time course of uIPSCs suppression for CB1R-positive and -negative basket cells. Recovery is fitted with a single exponential.
Figure 2
Figure 2
Characterization of morphological, intrinsic and synaptic properties of CB1R-positive and -negative basket cells. (a) Top, reconstructions of CB1R-positive (left; red, axon; gray, dendrite) and -negative (right; blue, axon; gray, dendrite) basket cells shown in Figure 1a (all reconstructed cells are illustrated in Supplementary Fig. 1). SO, stratum oriens; SP, stratum pyrimidale; SR, stratum radiatum; SLM, stratum lacunosum-moleculare. Bottom, axonal (squares; n = 16 and 11) and dendritic (thin lines; n = 13 and 11; dotted lines represent SP; gray pyramidal cell for reference) density distributions of reconstructed basket cells. Axonal distributions are fit by Gaussians (thick lines; hw = half width). (b) Summary of membrane time constant (top) and input resistance (bottom) for CB1R-positive (red; n = 18 and 22) and -negative (blue; n = 22 and 26) basket cells. Asterisks represent statistical significance (P < 0.0001). (c) Instantaneous spike frequency of CB1R-positive (n = 28) and CB1R-negative (n = 26) basket cells in response to depolarizing current pulses. Voltage traces from cells in a. (d) Summary graphs of peak conductance (top), rise time and decay time constant (middle), and paired pulse ratio (50 Hz, bottom) of uIPSCs evoked by CB1R-positive (red; n = 28, 26, 24 and 21) and -negative (blue; n = 26, 24, 23 and 12) basket cells. (e) Action potentials from cells in a and corresponding uIPSC in the postsynaptic pyramidal cell (black) on an expanded time scale (vertical lines are separated by 1 ms). Squares, average latencies (between action potential peak and uIPSC onset) for CB1R-positive (top, n = 27) and -negative (bottom, n = 24) basket cells.
Figure 3
Figure 3
Distinct excitation of CB1R-positive and -negative basket cells. (a) Left, schematic of recording configuration. Monosynaptic EPSCs recorded in a CB1R-positive (middle) and -negative (right) basket cell by stimulating three excitatory pathways. (b) Top, EPSC recorded simultaneously in connected basket-to–pyramidal cell pairs in response to Schaffer collaterals stimulation. Same cells as in a. In a and b, EPSCs were recorded in the presence of gabazine (2.5 μM) or at the IPSC reversal potential (−85 mV). Bottom, scatter plot of the amplitude of Schaffer collateral and perforant path EPSCs recorded in CB1R-positive (Schaffer collaterals, n = 16; Perforant path, n = 7) and -negative (Schaffer collaterals, n = 16; Perforant path, n = 5) versus their paired pyramidal cells. Dotted line, unity.
Figure 4
Figure 4
Distinct dynamics of excitation of CB1R-positive and -negative basket cells. (a) Top, current traces in response to Schaffer collateral stimulation at 20 Hz in CB1R-positive and -negative basket cells (the traces have been scaled to the first EPSC). Bottom, summary graph of normalized EPSC amplitudes plotted against stimulus number. CB1R-negative cell is same as in Figure 3. All EPSCs in this figure were recorded in presence of gabazine (2.5 μM) or at the IPSC reversal potential (−85 mV). (b) Top, current traces in response to perforant path stimulation in CB1R-positive and -negative basket cells. Bottom, normalized EPSC amplitudes plotted against stimulus number. Both basket cells are the same as in Figure 3. (c) Top, current traces in response to alveus stimulation in CB1R-positive and -negative basket cells. Bottom, normalized EPSC amplitudes plotted against stimulus number.
Figure 5
Figure 5
Transient recruitment of CB1R-positive basket cells. (a) Left, ten superimposed voltage traces from CB1R-positive and -negative basket cells during 20 Hz alveus stimulation at threshold for spiking on the first stimulus. Action potentials have been truncated. CB1R-positive cell is the same as that shown in Figure 1c. Right, spiking probability plotted for each stimulus in the train, normalized to the probability of spiking in response to the first stimulus in CB1R-positive and -negative basket cells. (b) Upper traces, disynaptic IPSCs recorded in a pyramidal cell in response to repetitive alveus stimulation (five stimuli at 20 Hz) before (black), directly after (green) and upon recovery from (gray) depolarization (0 mV, 5 s). Insets, first and fifth responses scaled. Lower traces, the DSI-sensitive component was isolated by subtracting the green from the black trace (top panel). Right, the CB1R antagonist AM251 (5 μM) blocked suppression of the IPSC. The glutamate receptor antagonist NBQX (10 μM) abolished the IPSCs, confirming their disynaptic nature. (c) Upper traces, monosynaptic IPSCs (five stimuli at 20 Hz) in the presence of NBQX with the stimulation electrode placed near the pyramidal cell body. Lower traces, the DSI-sensitive component was isolated as in b, and the CB1R antagonist blocked suppression of the IPSC. (d) DSI plotted against stimulus number for monosynaptic (black) and disynaptic (red) IPSCs.
Figure 6
Figure 6
Distinct integration time windows in CB1R-positive and -negative basket cells. (a) Recording configuration. (b) Left, current traces from CB1R-positive and -negative basket (top) and pyramidal cell (bottom) pairs in response to alveus stimulation in control and gabazine, and the algebraic subtraction of the traces (thick line). CB1R-positive cell is the same as that in Figure 1b. Right, scatter plot of IPSCs onto paired basket and pyramidal cells elicited by Schaffer collateral (n = 11 and 13 for CB1R-positive and -negative basket cells, respectively) and alveus (n = 12 for both CB1R-positive and -negative basket cells) stimulation. (c) Top, superimposed average voltage traces from basket cells in response to Schaffer collateral stimulation (black arrow) followed, with increasing delays, by alveus stimulation (gray arrows). Data from same cells as those in b. Bottom, summation is computed as the peak amplitude of the summed response (x) minus the peak amplitude of the feedback postsynaptic potential (PSP) alone (y), normalized by the peak of the feedforward PSP (z). The result is plotted against the interstimulus interval (ISI) for CB1R-positive and -negative basket cells. Red line, membrane time constant of CB1R-positive basket cells. (d) Top, superimposed average voltage traces from a CB1R-negative basket cell in control and in the presence of gabazine for the same protocol as in c. Bottom, summation is plotted against the ISI in control (same data as in c) and in gabazine. Blue line, membrane time constant of CB1R-negative basket cells.
Figure 7
Figure 7
Differential contribution of CB1R-positive and -negative basket cells to feed-forward and feedback inhibition. (a) Left, recording configuration. Center, voltage-clamp recording from an interneuron in response to Schaffer collateral stimulation at three different intensities (2.5 μM gabazine). Note the appearance of a late, feedback EPSC at stronger stimulation intensities. Dotted trace, the EPSC recorded at low stimulus intensity is scaled to the peak of the early component elicited at strong stimulation intensities. Right, delays between feedforward and feedback EPSCs (n = 7). (b) Same data as in Figure 6c plotted on a logarithmic axis. The vertical gray shaded region represents the range of delays recorded in a. (c) Left, recording configuration. Right, ten superimposed current traces from CB1R-positive (top, red) and -negative (bottom, blue) basket cells at threshold for spiking in response to Schaffer collateral stimulation. Action potentials have been truncated. (d) Left, average of responses that did not elicit an action potential (same cells as in c). Note the discontinuity (arrow) in the rise of the EPSP in the CB1R-positive cell, due to the onset of the feedback EPSP. Right, summary of latency to spike and jitter in CB1R-positive (n = 4) and -negative (n = 9) basket cells. (e) Left, recording configuration. Right, voltage-clamp recording from a pyramidal cell in response to Schaffer collateral stimulation at two different intensities (blue trace, low intensity; black trace, high intensity). Note the appearance of a late, feedback IPSC at the stronger stimulation intensity. Dotted trace, the feedforward IPSC elicited at low stimulation intensity scaled to the peak of the feedforward IPSC elicited at high intensity. (f) Feedforward and feedback IPSCs before (black), directly after (green) and on recovery from (gray) depolarization. Right, summary of suppression of the feedforward and feedback IPSCs (n = 5).

Similar articles

Cited by

References

    1. Andersen P, Eccles JC, Loyning Y. Recurrent inhibition in the hippocampus with identification of the inhibitory cell and its synapses. Nature. 1963;198:540–542. - PubMed
    1. Mann EO, Suckling JM, Hajos N, Greenfield SA, Paulsen O. Perisomatic feedback inhibition underlies cholinergically induced fast network oscillations in the rat hippocampus in vitro. Neuron. 2005;45:105–117. - PubMed
    1. Cobb SR, Buhl EH, Halasy K, Paulsen O, Somogyi P. Synchronization of neuronal activity in hippocampus by individual GABAergic interneurons. Nature. 1995;378:75–78. - PubMed
    1. Miles R, Toth K, Gulyas AI, Hajos N, Freund TF. Differences between somatic and dendritic inhibition in the hippocampus. Neuron. 1996;16:815–823. - PubMed
    1. Pouille F, Scanziani M. Enforcement of temporal fidelity in pyramidal cells by somatic feed-forward inhibition. Science. 2001;293:1159–1163. - PubMed

Publication types

MeSH terms