. 2006 Apr 26;26(17):4535-45.
doi: 10.1523/JNEUROSCI.5297-05.2006.

Neocortical network activity in vivo is generated through a dynamic balance of excitation and inhibition

Affiliations

Neocortical network activity in vivo is generated through a dynamic balance of excitation and inhibition

Bilal Haider et al. J Neurosci. .

Abstract

The recurrent excitatory and inhibitory connections between and within layers of the cerebral cortex are fundamental to the operation of local cortical circuits. Models of cortical function often assume that recurrent excitation and inhibition are balanced, and we recently demonstrated that spontaneous network activity in vitro contains a precise balance of excitation and inhibition; however, the existence of a balance between excitation and inhibition in the intact and spontaneously active cerebral cortex has not been directly tested. We examined this hypothesis in the prefrontal cortex in vivo, during the slow (<1 Hz) oscillation in ketamine-xylazine-anesthetized ferrets. We measured persistent network activity (Up states) with extracellular multiple unit and local field potential recording, while simultaneously recording synaptic currents in nearby cells. We determined the reversal potential and conductance change over time during Up states and found that the body of Up state activity exhibited a steady reversal potential (-37 mV on average) for hundreds of milliseconds, even during substantial (21 nS on average) changes in membrane conductance. Furthermore, we found that both the initial and final segments of the Up state were characterized by significantly more depolarized reversal potentials and concomitant increases in excitatory conductance, compared with the stable middle portions of Up states. This ongoing temporal evolution between excitation and inhibition, which exhibits remarkable proportionality within and across neurons in active local networks, may allow for rapid transitions between relatively stable network states, permitting the modulation of neuronal responsiveness in a behaviorally relevant manner.


Figures

Figure 1.
Figure 1.
Spontaneous recurrent network activity in RS neurons of ferret prefrontal cortex in vivo. A, Simultaneous LFP (top), extracellular MU (middle), and intracellular (Vm) (bottom) recording reveals rhythmic cycle of local network activation (Up states; solid line), during which RS neurons become depolarized and fire action potentials simultaneous with the local network. Depolarization and action potential firing is followed by network quiescence (Down states; dashed line), during which membrane potential becomes hyperpolarized, and network activity ceases. B, Hyperpolarization of the same RS neuron with negative DC reveals the synaptic barrages underlying the depolarizing envelope of the Up state (Vm; bottom trace) that occur simultaneously with local network activity (middle and top; LFP and MU have same scale as in A). Distance between intracellular and extracellular recording was <500 μm. C, PSTH constructed from the same cell as in A shows stable period of elevated spike rate during Up states. D, PSTH constructed from MU spikes recorded simultaneously as trials in C shows similar stable periods of network firing during Up states. E, F, Overlays of LFP and membrane potential of >10 Up states, aligned to the start and end of the Up state (arrows), reveal the rapid transitions, and the stable plateau of depolarization during Up states. Negative DC was injected to prevent spikes.
Figure 2.
Figure 2.
Fast-spiking interneurons are strongly activated during Up states. A, Simultaneous LFP (top), extracellular MU (middle), and intracellular (Vm) (bottom) recording reveals rhythmic cycle of Up/Down states, during which electrophysiologically identified FS interneurons become active simultaneously with the local network. B, Hyperpolarization of same FS neuron with negative DC reveals synaptic barrages during Up states. MU and LFP have same scale as in A. C, PSTH constructed from same cell as shown in B (at later time and with no holding current) shows stable period of elevated spike rate during Up states. D, PSTH constructed from MU spikes recorded simultaneously as trials in C shows similar stable periods of network firing during Up states. E, F, Overlays of LFP and Vm from same FS cell (>10 Up states), aligned to the start and end of the Up state (arrows), demonstrate stability during the Up state. Negative DC was injected to prevent spikes.
Figure 3.
Figure 3.
Both excitatory and inhibitory synaptic barrages occur during Up states. A, In current-clamp mode, hyperpolarized membrane potential values (−80 mV; bottom trace) show depolarizations during Up states, whereas depolarized membrane potential values (+5 mV; top trace) reveal hyperpolarizations during Up states. Intermediate potentials (middle traces) exhibit a mixture of depolarizing and hyperpolarizing synaptic activity. The membrane potential labels refer to those achieved at the peak of the Up state. B, SEVC reveals synaptic currents at the soma that underlie Up states. Negative holding potentials (−85 mV; bottom trace) reveal inward currents during Up states, whereas positive holding potentials (0 mV; top trace) show outward currents during Up states. A mixture of excitatory and inhibitory currents is present at intermediate holding potentials (−35 to −25 mV; middle traces).
Figure 4.
Figure 4.
Method for estimation of synaptic reversal potential during Up states. A, Single neurons are progressively moved through a series of holding potentials at which many successive Up states are recorded (single trial current; top arrow) and aligned to the starts of Up states to produce the average Up state evoked current (average current; bottom arrow) for each holding potential. B, Current–voltage plots across the range of holding potentials are constructed for both Down state (black dashed line) and for each point during the Up state (e.g., 400 ms after Up start; gray dashed line). The intersection point of the two IV plots represents the reversal potential for the Up state at that particular time.
Figure 5.
Figure 5.
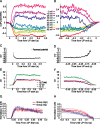
Currents evoked during Up states exhibit a steady reversal potential. A, Average synaptic currents recorded for 500 ms and aligned to the start of the Up state, for many different holding potentials. B, Synaptic currents recorded at various holding potentials, from 500 ms before the end (0 ms) of the Up state. Baseline current is subtracted in both A and B. C, Plot of reversal potential over time, calculated from current–voltage relationships in the first 500 ms, shows a steady reversal potential during the course of the Up state (−38.3 ± 1.16 mV from 100 to 500 ms). D, Similar plot of reversal potential over time, aligned to end of the Up state, exhibits a stable value (−34.5 ± 1.24 from −500 to −250 ms) before the collapse of the Up state. Note depolarized reversal potentials at both initiation and cessation of Up state. E, Total conductance change evoked from Down to Up transition (mean gTotal, 15.0 ± 1.0 nS) remains steady during the course of the Up state. Excitatory and inhibitory conductances rise and fall together and remain steady during the Up state (mean ge, 7.4 ± 0.4 nS; mean gi, 7.7 ± 0.7 nS). F, Similar plot aligned on end of the Up state shows that total, excitatory, and inhibitory conductances remain steady until the Up state begins to collapse (from −500 to −250 ms; mean gTotal, 11.7 ± 0.6 nS; mean ge, 6.3 ± 0.2 nS; gi, 5.4 ± 0.4 nS). Note relative increase in ge toward the end of Up state. G, Population (n = 8) excitatory (Ge; solid red line) and inhibitory (Gi; solid blue line) conductances aligned on start of the Up state and calculated for 500 ms thereafter. Ge and Gi for each neuron normalized to peak Gtotal in that cell. Excitation leads at the beginning, inhibition is rapidly engaged, and then the two remain balanced thereafter. The dashed lines indicate SEM. H, Similar group plot of Ge and Gi aligned on the end of the Up state. Ge and Gi normalized to peak Gtotal for each neuron. Ge is significantly greater than Gi for ∼150 ms before Up state collapse (−301 to −147 ms before Up end; Ge > Gi; paired Wilcoxon sign rank test; p < 0.01).
Figure 6.
Figure 6.
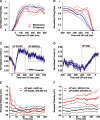
Excitation dominates both the beginning and end of Up states. A, Peak normalized population firing rates of extracellularly recorded and electrophysiologically identified RS (thick red line; n = 6) and FS (thick blue line; n = 6) neurons, aligned on the start of the Up state (>50 Up states/neuron; RS = 6.7 ± 2.4 Hz; FS = 24.7 ± 9.1 Hz before normalization). The dashed lines indicate SEM. B, Similar plot as A aligned on the end of the Up state. Normalized RS firing is significantly elevated compared with FS firing for 200 ms before Up end (−200 to 0 ms before Up end; RS > FS; paired Wilcoxon sign rank test; p < 0.01). C, Average synaptic currents recorded when the membrane potential is held near the reversal potential of the body of the Up state, traces aligned on the start of the Up state. Peak normalized average currents (thick blue line) recorded at the two holding potentials immediately adjacent to the calculated reversal potential for each neuron (n = 5). Near reversal potential, the Up state is clearly dominated by excitation for the first 50 ms before the current swings toward outward. The dashed lines represent the SEM. D, Similar plot to C, aligned at the end of the Up state. Note the increase in inward excitatory current preceding transition from Up to Down. E, Population average reversal potential for same neurons as in C and D, calculated for the first 200 ms from Up onset (Up start; C, red box), and compared against the reversal potential calculated from 300–500 ms (Up middle; C, black box) into the Up state. The reversal potential from 0 to 43 ms of the Up state (red trace) is significantly more depolarized than the reversal potential (black trace) during the body of the Up state (paired Wilcoxon sign rank test; p < 0.01). The dashed lines represent the SEM. F, Similar plot as E but aligned to the end of the Up state. Population average reversal potential calculated for last 200 ms preceding collapse of the Up state (Up end; D, red box), compared with 200 ms from the middle of the Up state, same as in E. Reversal potential from −200 to 0 ms preceding Up end (red trace) is significantly more depolarized than segment from the stable middle portion (black trace) of the Up state (paired Wilcoxon sign rank test; p < 0.01).
Figure 7.
Figure 7.
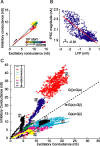
Excitatory and inhibitory conductances are proportional and balanced during Up states. A, Plot of calculated excitatory and inhibitory conductances in a single neuron during the course of the Up state (0–500 ms, indicated by progressive movement through color bar) shows that excitation and inhibition remain proportional and nearly equal despite large changes in total conductance (slope of linear fit, m = 0.98; r2 = 0.78). Note that the start of the Up state shows a deviation toward excitation, but rapidly swings toward inhibition and thereafter exhibits a balance between the two. B, Scatterplot of IPSC magnitude versus the amplitude of the nearby (<500 μm) LFP during the course of the Up state. The intensity of IPSCs mirrors the intensity of population activity (r2 = −0.81) over time. Correlation is negative since downward deflections of the LFP indicate network activation. C, Excitation and inhibition are proportional and balanced both within and across neurons during recurrent network activity. Scatterplot of excitatory versus inhibitory conductances for a population of neurons (n = 8), calculated for 500 ms from the start of the Up state. Note the linear relationship for each individual neuron, as well as the clustering around a ratio of equal excitatory and inhibitory conductances (Ge = Gi; dashed line; 4 of 8 cells biased toward excitation, 3 of 8 cells toward inhibition, 1 of 8 cells approximately equal; population reversal potential, −37.2 ± 6.5 mV).

Similar articles

Cited by

References

    1. Anderson J, Lampl I, Reichova I, Carandini M, Ferster D (2000). Stimulus dependence of two-state fluctuations of membrane potential in cat visual cortex. Nat Neurosci 3:617–621. - PubMed
    1. Anderson JS, Carandini M, Ferster D (2000). Orientation tuning of input conductance, excitation, and inhibition in cat primary visual cortex. J Neurophysiol 84:909–926. - PubMed
    1. Arieli A, Shoham D, Hildesheim R, Grinvald A (1995). Coherent spatiotemporal patterns of ongoing activity revealed by real-time optical imaging coupled with single-unit recording in the cat visual cortex. J Neurophysiol 73:2072–2093. - PubMed
    1. Azouz R, Gray CM (1999). Cellular mechanisms contributing to response variability of cortical neurons in vivo. J Neurosci 19:2209–2223. - PMC - PubMed
    1. Binzegger T, Douglas RJ, Martin KAC (2004). A quantitative map of the circuit of cat primary visual cortex. J Neurosci 24:8441–8453. - PMC - PubMed

Publication types

LinkOut - more resources