. 2006 Apr 17;203(4):973-84.
doi: 10.1084/jem.20050625. Epub 2006 Apr 10.

Postnatal acquisition of endotoxin tolerance in intestinal epithelial cells

Affiliations

Postnatal acquisition of endotoxin tolerance in intestinal epithelial cells

Michael Lotz et al. J Exp Med. .

Abstract

The role of innate immune recognition by intestinal epithelial cells (IECs) in vivo is ill-defined. Here, we used highly enriched primary IECs to analyze Toll-like receptor (TLR) signaling and mechanisms that prevent inappropriate stimulation by the colonizing microflora. Although the lipopolysaccharide (LPS) receptor complex TLR4/MD-2 was present in fetal, neonatal, and adult IECs, LPS-induced nuclear factor kappaB (NF-kappaB) activation and chemokine (macrophage inflammatory protein 2 [MIP-2]) secretion was only detected in fetal IECs. Fetal intestinal macrophages, in contrast, were constitutively nonresponsive to LPS. Acquisition of LPS resistance was paralleled by a spontaneous activation of IECs shortly after birth as illustrated by phosphorylation of IkappaB-alpha and nuclear translocation of NF-kappaB p65 in situ as well as transcriptional activation of MIP-2. Importantly, the spontaneous IEC activation occurred in vaginally born mice but not in neonates delivered by Caesarean section or in TLR4-deficient mice, which together with local endotoxin measurements identified LPS as stimulatory agent. The postnatal loss of LPS responsiveness of IECs was associated with a posttranscriptional down-regulation of the interleukin 1 receptor-associated kinase 1, which was essential for epithelial TLR4 signaling in vitro. Thus, unlike intestinal macrophages, IECs acquire TLR tolerance immediately after birth by exposure to exogenous endotoxin to facilitate microbial colonization and the development of a stable intestinal host-microbe homeostasis.


Figures

Figure 1.
Figure 1.
Characterization of primary IEC preparations. (A) Visualization of isolated primary epithelial cell aggregates comprising intestinal villi with the attached crypts by phase contrast microscopy. Bar, 1 μm. Phalloidin staining of freshly isolated primary cells illustrating actin accumulation along apical microvilli. Bar, 30 μm. (B) Verification of the polarized phenotype of primary IECs by immunostaining for E-cadherin (left) and ZO-1 (right). The depicted images show a three-dimensional reconstruction of the polarized, multicellular epithelial cell complex to illustrate the cellular structure. Bar, 10 μm. (C) Determination of cell viability and apoptosis of primary IECs by propidium iodine (PI) exclusion analysis and FITC–annexin V staining. (D) Staining for nonepithelial hematopoietic (CD45+) cells of a representative preparation of primary IECs using anti-CD11b, anti-CD3, and anti-B220 antibodies.
Figure 2.
Figure 2.
Intracellular LPS receptor expression by primary IECs. (A) RT-PCR analysis for TLR4 and MD-2 expression in intestinal epithelium from fetal, 1-, and 6-d-old newborn as well as adult intestinal tissue obtained by laser microdissection. Detection of CD45 expression was used to demonstrate the absence of myeloid cells in the dissected tissue. Macrophage-like RAW 264.7 cells were used as positive control for CD45 expression. β2-microglobulin (β2m) expression was used as a housekeeping control. The hematoxylin-stained tissue section illustrates the microdissection procedure. Bar, 500 μm. (B) FACS analysis of isolated primary IECs from fetal (day −1) and adult (day 28) murine intestine for the expression of the LPS receptor complex TLR4/MD-2. RAW 264.7 cells were used as positive control. Dotted line, isotype control. (C) FACS analysis using double immunostaining of primary IECs for isotype antibodies (left) or TLR4/MD-2 and E-cadherin (right) to confirm epithelial TLR4 expression. Primary IECs were isolated from 6-d-old mice. (D) Staining of murine peritoneal macrophages as well as primary IECs isolated from adult (day 28) and fetal (day −1) intestinal tissue for TLR4/MD-2 with or without permeabilization of the cellular membrane to illustrate surface TLR expression. Dotted line, isotype control. (E) LPS internalization of primary IECs. Cells were incubated in the presence of 100 ng/ml S. typhimurium LPS and immunostained using two monoclonal antibodies directed against the LPS O-antigen. Counterstaining with FITC-phalloidin and DAPI. Bar, 20 μm.
Figure 3.
Figure 3.
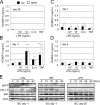
Stimulation of isolated primary IECs. MIP-2 and KC concentrations in the cell culture supernatant of primary IECs isolated from adult mice (day 28; A), late gestational fetuses (day −1; B), newborn mice (day 1; C), or 6-d-old mice (D). Cells were stimulated with 1 or 10 ng/ml LPS, 100 ng/ml IL-1β, or 50 ng/ml TNF for 12 h. Values are presented as means ± SD. *, P < 0.05; **, P < 0.01. (E) Immunoblot analysis of p65 and IκB-α phosphorylation in primary IECs isolated from fetal (day −1) or adult (day 28) mice 10, 20, 40, and 60 min after stimulation with 100 ng/ml LPS or 50 ng/ml TNF. Equal sample loading is illustrated by actin and total p65 staining.
Figure 4.
Figure 4.
Transient postnatal activation and LPS susceptibility of primary IECs. (A) Characterization of intracellular MIP-2 staining using nonactivated or LPS (100 ng/ml) -stimulated peritoneal macrophages. (B) Intracellular MIP-2 staining of primary IECs isolated from late gestational fetal, 6-, and 28-d-old mice. MIP-2 was cytometrically analyzed after 6 h of incubation in the presence of brefeldin A under nonstimulating conditions or after the addition of 100 ng/ml LPS. Dotted line, isotype control. (C) Double immunostaining and FACS analysis of primary IECs from 6-d-old mice with MIP-2 and E-cadherin to identify spontaneous MIP-2 production in IECs. (D) MIP-2 (red) in IECs from 6-d-old mice was detected by intracellular staining with a rabbit anti–MIP-2 antiserum (MIP-2) or an irrelevant affinity-purified rabbit control serum after incubation for 6 h in the presence of 0.5 μg/ml brefeldin A. Isolated IECs were identified as epithelial cells by E-cadherin staining (green). Counterstaining with DAPI. Bar, 20 μm.
Figure 5.
Figure 5.
Constitutive LPS resistance of intestinal macrophages. (A) Characterization of the isolated intestinal macrophage preparation by CD45 (top) and BM8 (bottom) expression. (B) Analysis of surface B7.1 (top) and CD40 (bottom) expression on intestinal macrophages from fetal (bold), 1- (normal), 3- (thin), and 28-d-old (dotted line) mice. (C) B7.1 (top) and CD40 (bottom) expression on fetal intestinal macrophages (left) and RAW 264.7 cells (right) after overnight incubation in the absence or presence of 100 ng/ml LPS. MIP-2 (D) and TNF (E) secretion by blood monocytes and intestinal macrophages from fetal mice after overnight stimulation with LPS, 100 ng/ml IL-1β, 50 ng/ml TNF, and phorbol ester (5 μM PMA). *, not detectable.
Figure 6.
Figure 6.
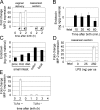
Time course of postnatal IEC activation. (A) Quantitative MIP-2 mRNA analysis in total small intestinal tissue from fetal, 1-, 3-, 6-, and 15-d-old mice. HPRT expression was used for normalization. Values are presented as RQ ± RQ maximum and minimum, respectively, and indicate MIP-2 mRNA expression relative to the fetal tissue sample. (B) Quantitative MIP-2 mRNA analysis in isolated primary IECs from fetal, 1-, 3-, and 6-d-old mice. (C) Quantitative MIP-2 mRNA analysis in total small intestinal tissue 0, 1, 2, 4, and 6 h after birth. (D) Immunostaining of neonatal small intestinal tissue obtained 0 and 60 min after delivery. The arrows indicate the cytoplasmic (0 min) or nuclear (60 min) cellular distribution of the NF-κB subunit p65. A secondary antibody control illustrates the specificity of the immunostaining. Counterstaining with DAPI. Bar, 50 μm. (E) Immunostaining for phosphorylated IκB-α in neonatal small intestinal tissue obtained 0, 45, and 60 min after delivery. Counterstaining with hematoxylin. Bar, 100 μm. (F) Immunostaining of small intestinal tissue from 1-, 6-, and 28-d-old mice for the presence of CD45+ (green) immune cells. Counterstaining with TRITC-phalloidin. Bar, 250 μm.
Figure 7.
Figure 7.
Characterization of the stimulus of postnatal epithelial activation. (A) Quantitative MIP-2 mRNA analysis in total small intestinal tissue of newborn mice 0 and 2 h after vaginal delivery or Caesarean section. #1 and #2 identify individual mice examined. (B) LPS concentration in total small intestinal homogenate of normally delivered newborn mice at the indicated time after birth. (C) LPS concentration in intestinal content and fecal samples of adult mice (n = 4). (D) Quantitative MIP-2 mRNA analysis in total small intestinal tissue of fetal or neonatal mice born by Caesarean section 3 h after oral exposure to LPS at the indicated concentrations. (E) Quantitative MIP-2 mRNA analysis in total small intestinal tissue of wild-type as well as TLR4-deficient newborn mice after vaginal delivery.
Figure 8.
Figure 8.
Postnatal depletion of IRAK-1 in IECs. (A) Immunoblot for IRAK-1 in primary IECs isolated from fetal (day −1), 1-, 3-, and 6-d-old mice. A secondary antibody control was included to demonstrate the specificity of the IRAK-1 staining. Actin was included as loading control. (B) Analysis of IRAK-1 expression in LMD-isolated primary IECs. HPRT was included as housekeeping control. (C) Immunostaining for IRAK-1 in small intestinal tissue of fetal (day −1), 1-, and 6-d-old mice. A peptide control illustrates the specificity of the immunstaining. Counterstaining with DAPI. Bar, 100 μm. (D–F) Immunoblot for IRAK-1 in macrophage-like RAW 264.7 cells and mouse intestinal epithelial m-ICcl2 cells at the indicated time points (hours) after exposure to 100 ng/ml LPS. (G) Immunoblot for IRAK-1 in mouse intestinal epithelial m-ICcl2 cells 2 h after exposure to 100 ng/ml LPS in the absence or presence of 25 μM of the kinase inhibitor K-252b. Actin was included as loading control. (H) Immunoblot for IRAK-1 in mouse intestinal epithelial m-ICcl2 cells left untreated or stimulated with 100 ng/ml LPS for 6 h (left). m-ICcl2 cells transfected with an ubiquitin expression plasmid and stimulated with 100 ng/ml LPS for 0 or 0.5 h were immunoprecipitated using a polyclonal anti-ubiquitin antibody and immunoblotted to visualize IRAK-1 (right). Note the size difference between native and ubiquitinated IRAK-1. HC, heavy chain; LC, light chain.
Figure 9.
Figure 9.
Role of IRAK-1 in epithelial TLR4 signaling and endotoxin tolerance. (A) MIP-2 secretion of intestinal epithelial m-ICcl2 cells transfected with a control plasmid or a dominant-negative construct of IRAK-1. Cells were initially incubated in the presence or absence of 1 μg/ml LPS for 6 h, recovered for 36 h in LPS-free medium, and restimulated with 100 ng/ml LPS for 6 h. (B) Cotransfection of a dominant-negative version of IRAK-1 with an NF-κB luciferase reporter construct. Luciferase production in response to LPS stimulation of naive and LPS-tolerant cells carrying a control plasmid or a dominant-negative construct of IRAK-1. (C) Restored LPS responsiveness of tolerant epithelial cells by overexpression of IRAK-1. Naive and tolerant m-ICcl2 cells were left untreated or transfected with a control or IRAK-1 expression construct before second stimulation. Significant reduction (P < 0.01) of MIP-2 secretion in tolerant cells was observed in mock or pFlag-transfected but not in pIRAK-1–transfected cells. (D) Immunoblot demonstrating IRAK-1 levels in naive cells as well as in tolerant mock-, pFlag-, and pIRAK-1–transfected cells. (E) Immunostaining for the NF-κB subunit p65 (red) showing nuclear translocation in naive cells as well as pIRAK-1–transfected (green) tolerant cells in response to LPS stimulation. n.s., not significant. Counterstaining with DAPI. Bar, 40 μm.

Similar articles

Cited by

References

    1. Hooper, L.V., J. Xu, P.G. Falk, T. Midtvedt, and J.I. Gordon. 1999. A molecular sensor that allows a gut commensal to control its nutrient foundation in a competitive ecosystem. Proc. Natl. Acad. Sci. USA. 96:9833–9838. - PMC - PubMed
    1. Medzhitov, R. 2001. Toll-like receptors and innate immunity. Nat. Rev. Immunol. 1:135–145. - PubMed
    1. Abreu, M.T., P. Vora, E. Faure, L.S. Thomas, E.T. Arnold, and M. Arditi. 2001. Decreased expression of Toll-like receptor-4 and MD-2 correlates with intestinal epithelial cell protection against dysregulated proinflammatory gene expression in response to bacterial lipopolysaccharide. J. Immunol. 167:1609–1616. - PubMed
    1. Naik, S., E.J. Kelly, L. Meijer, S. Pettersson, and I.R. Sanderson. 2001. Absence of Toll-like receptor 4 explains endotoxin hyporesponsiveness in human intestinal epithelium. J. Pediatr. Gastroenterol. Nutr. 32:449–453. - PubMed
    1. Cario, E., I.M. Rosenberg, S.L. Brandwein, P.L. Beck, H.C. Reinecker, and D.K. Podolsky. 2000. Lipopolysaccharide activates distinct signaling pathways in intestinal epithelial cell lines expressing Toll-like receptors. J. Immunol. 164:966–972. - PubMed

Publication types

MeSH terms