

Genome-wide analysis of menin binding provides insights into MEN1 tumorigenesis
- PMID: 16604156
- PMCID: PMC1428788
- DOI: 10.1371/journal.pgen.0020051
Genome-wide analysis of menin binding provides insights into MEN1 tumorigenesis
Abstract
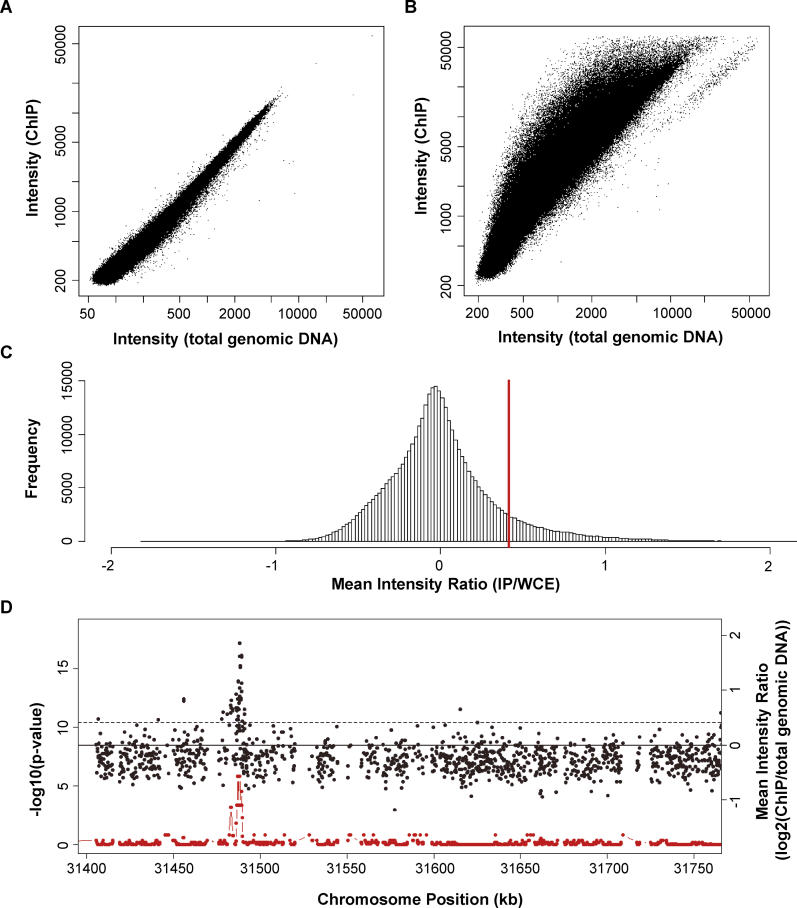
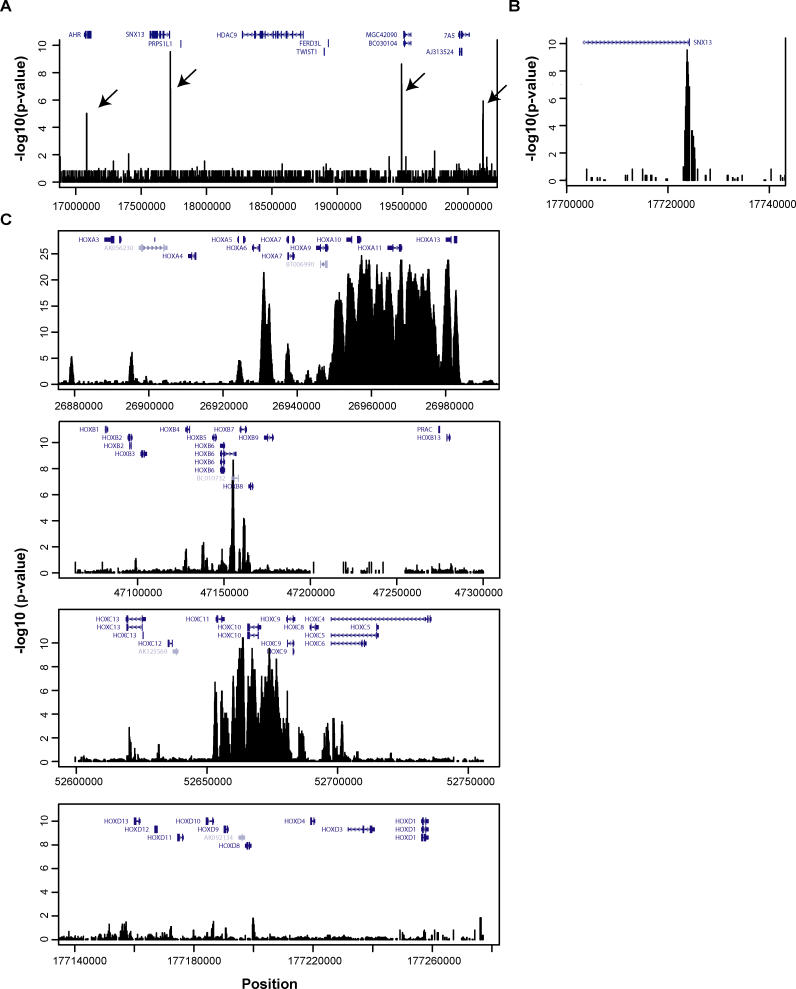
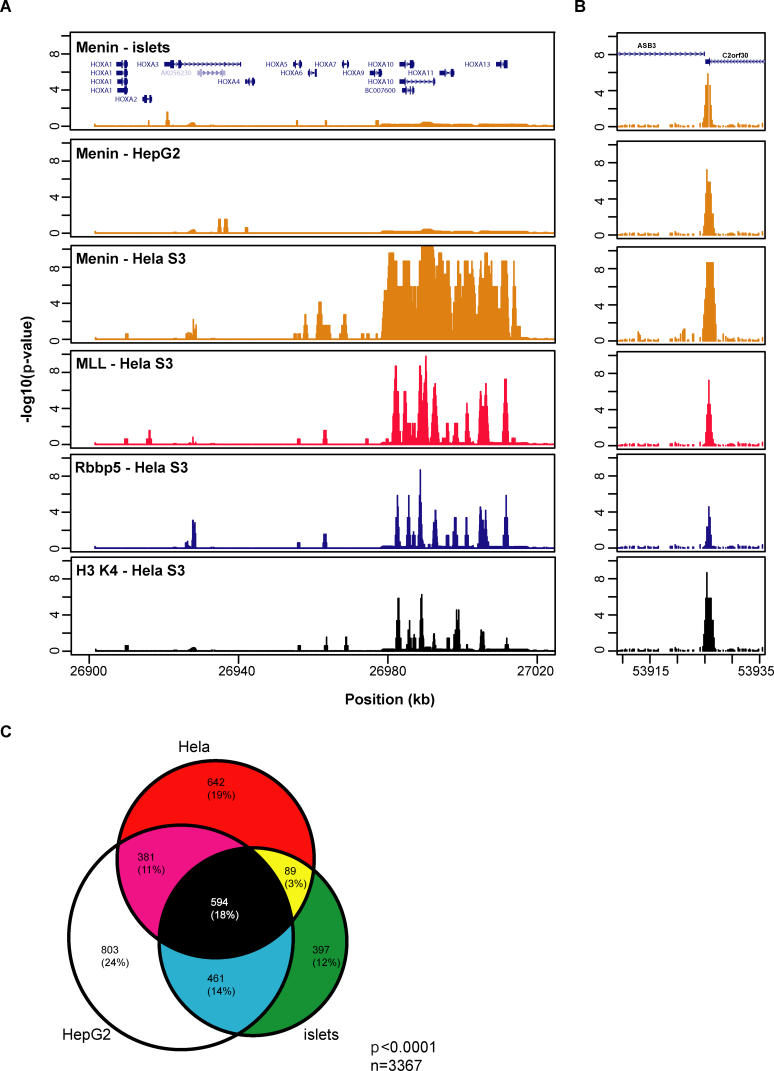
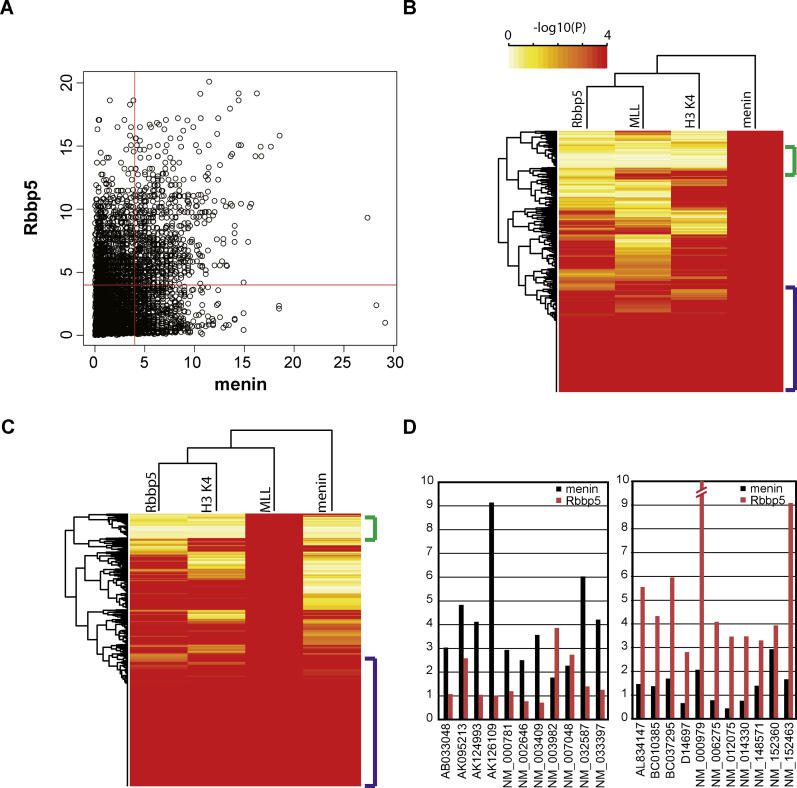
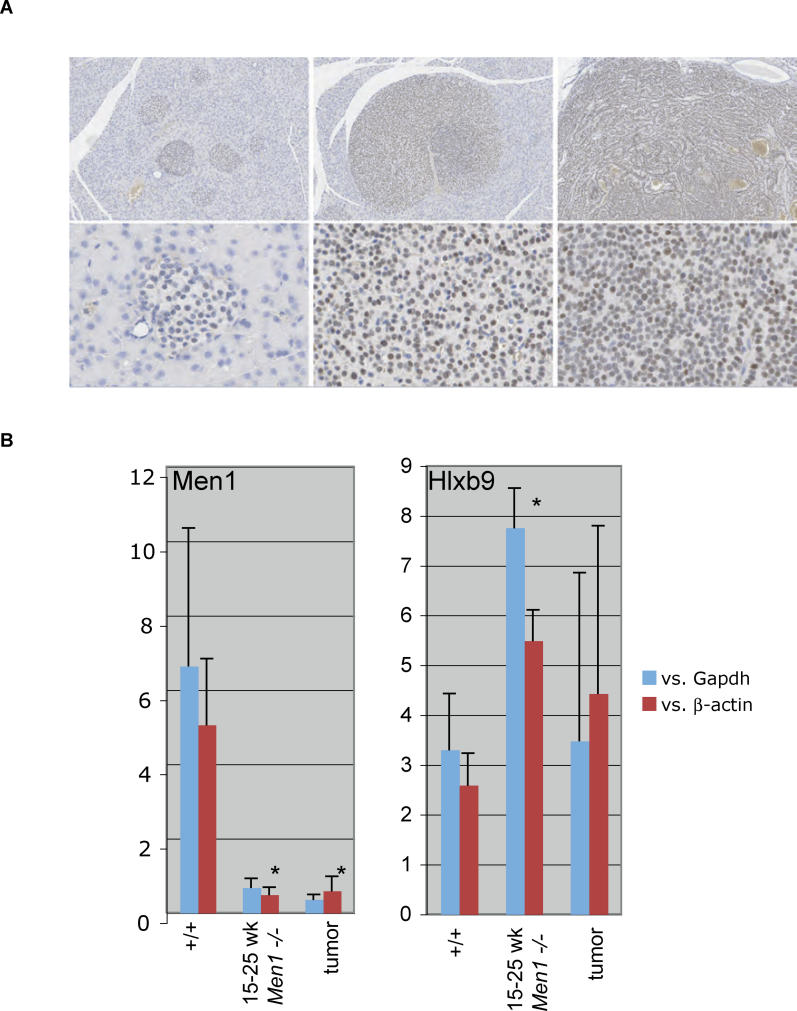
Multiple endocrine neoplasia type I (MEN1) is a familial cancer syndrome characterized primarily by tumors of multiple endocrine glands. The gene for MEN1 encodes a ubiquitously expressed tumor suppressor protein called menin. Menin was recently shown to interact with several components of a trithorax family histone methyltransferase complex including ASH2, Rbbp5, WDR5, and the leukemia proto-oncoprotein MLL. To elucidate menin's role as a tumor suppressor and gain insights into the endocrine-specific tumor phenotype in MEN1, we mapped the genomic binding sites of menin, MLL1, and Rbbp5, to approximately 20,000 promoters in HeLa S3, HepG2, and pancreatic islet cells using the strategy of chromatin-immunoprecipitation coupled with microarray analysis. We found that menin, MLL1, and Rbbp5 localize to the promoters of thousands of human genes but do not always bind together. These data suggest that menin functions as a general regulator of transcription. We also found that factor occupancy generally correlates with high gene expression but that the loss of menin does not result in significant changes in most transcript levels. One exception is the developmentally programmed transcription factor, HLXB9, which is overexpressed in islets in the absence of menin. Our findings expand the realm of menin-targeted genes several hundred-fold beyond that previously described and provide potential insights to the endocrine tumor bias observed in MEN1 patients.
Conflict of interest statement
Competing interests. The authors have declared that no competing interests exist.
Figures


Similar articles
-
Menin and MLL cooperatively regulate expression of cyclin-dependent kinase inhibitors.Proc Natl Acad Sci U S A. 2005 Jan 18;102(3):749-54. doi: 10.1073/pnas.0408836102. Epub 2005 Jan 7. Proc Natl Acad Sci U S A. 2005. PMID: 15640349 Free PMC article.
-
Leukemia proto-oncoprotein MLL forms a SET1-like histone methyltransferase complex with menin to regulate Hox gene expression.Mol Cell Biol. 2004 Jul;24(13):5639-49. doi: 10.1128/MCB.24.13.5639-5649.2004. Mol Cell Biol. 2004. PMID: 15199122 Free PMC article.
-
Mechanisms of disease: multiple endocrine neoplasia type 1-relation to chromatin modifications and transcription regulation.Nat Clin Pract Endocrinol Metab. 2006 Oct;2(10):562-70. doi: 10.1038/ncpendmet0292. Nat Clin Pract Endocrinol Metab. 2006. PMID: 17024155 Review.
-
The same pocket in menin binds both MLL and JUND but has opposite effects on transcription.Nature. 2012 Feb 12;482(7386):542-6. doi: 10.1038/nature10806. Nature. 2012. PMID: 22327296 Free PMC article.
-
Multiple endocrine neoplasia type 1.Front Horm Res. 2013;41:1-15. doi: 10.1159/000345666. Epub 2013 Mar 19. Front Horm Res. 2013. PMID: 23652667 Free PMC article. Review.
Cited by
-
Whole-Exome Screening and Analysis of Signaling Pathways in Multiple Endocrine Neoplasia Type 1 Patients with Different Outcomes: Insights into Cellular Mechanisms and Possible Functional Implications.Int J Mol Sci. 2024 Jan 15;25(2):1065. doi: 10.3390/ijms25021065. Int J Mol Sci. 2024. PMID: 38256138 Free PMC article.
-
SOX10-regulated promoter use defines isoform-specific gene expression in Schwann cells.BMC Genomics. 2020 Aug 8;21(1):549. doi: 10.1186/s12864-020-06963-7. BMC Genomics. 2020. PMID: 32770939 Free PMC article.
-
Homeobox protein HB9 binds to the prostaglandin E receptor 2 promoter and inhibits intracellular cAMP mobilization in leukemic cells.J Biol Chem. 2012 Nov 23;287(48):40703-12. doi: 10.1074/jbc.M111.308965. Epub 2012 Oct 8. J Biol Chem. 2012. PMID: 23048027 Free PMC article.
-
IKAROS and MENIN coordinate therapeutically actionable leukemogenic gene expression in MLL-r acute myeloid leukemia.Nat Cancer. 2022 May;3(5):595-613. doi: 10.1038/s43018-022-00366-1. Epub 2022 May 9. Nat Cancer. 2022. PMID: 35534777 Free PMC article.
-
Regulation of mir-196b by MLL and its overexpression by MLL fusions contributes to immortalization.Blood. 2009 Apr 2;113(14):3314-22. doi: 10.1182/blood-2008-04-154310. Epub 2009 Feb 2. Blood. 2009. PMID: 19188669 Free PMC article.
References
-
- Debelenko LV, Brambilla E, Agarwal SK, Swalwell JI, Kester MB, et al. Identification of MEN1 gene mutations in sporadic carcinoid tumors of the lung. Hum Mol Genet. 1997;6:2285–2290. - PubMed
-
- Farnebo F, Teh BT, Kytola S, Svensson A, Phelan C, et al. Alterations of the MEN1 gene in sporadic parathyroid tumors. J Clin Endocrinol Metab. 1998;83:2627–2630. - PubMed
-
- Heppner C, Kester MB, Agarwal SK, Debelenko LV, Emmert-Buck MR, et al. Somatic mutation of the MEN1 gene in parathyroid tumours. Nat Genet. 1997;16:375–378. - PubMed
-
- Zhuang Z, Ezzat SZ, Vortmeyer AO, Weil R, Oldfield EH, et al. Mutations of the MEN1 tumor suppressor gene in pituitary tumors. Cancer Res. 1997;57:5446–5451. - PubMed
Publication types
MeSH terms
Substances
Grants and funding
LinkOut - more resources
Full Text Sources
Other Literature Sources
Molecular Biology Databases
