Spatial dynamics of receptor-mediated endocytic trafficking in budding yeast revealed by using fluorescent alpha-factor derivatives
- PMID: 16574772
- PMCID: PMC1458652
- DOI: 10.1073/pnas.0601042103
Spatial dynamics of receptor-mediated endocytic trafficking in budding yeast revealed by using fluorescent alpha-factor derivatives
Abstract
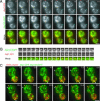
Much progress defining the order and timing of endocytic internalization events has come as a result of real-time, live-cell fluorescence microscopy. Although the availability of numerous endocytic mutants makes yeast an especially valuable organism for functional analysis of endocytic dynamics, a serious limitation has been the lack of a fluorescent cargo for receptor-mediated endocytosis. We have now synthesized biologically active fluorescent mating-pheromone derivatives and demonstrated that receptor-mediated endocytosis in budding yeast occurs via the clathrin- and actin-mediated endocytosis pathway. We found that endocytic proteins first assemble into patches on the plasma membrane, and then alpha-factor associates with the patches. Internalization occurs next, concomitant with actin assembly at patches. Additionally, endocytic vesicles move toward early endosomes on actin cables. Early endosomes also associate with actin cables, and they actively move toward endocytic sites to capture vesicles being released from the plasma membrane. Thus, endocytic vesicle formation and capture of the newly released vesicles by early endosomes occur in a highly concerted manner, mediated by the actin cytoskeleton.
Conflict of interest statement
Conflict of interest statement: No conflicts declared.
Figures


Similar articles
-
The yeast dynamin-like protein Vps1:vps1 mutations perturb the internalization and the motility of endocytic vesicles and endosomes via disorganization of the actin cytoskeleton.Eur J Cell Biol. 2010 Jul;89(7):499-508. doi: 10.1016/j.ejcb.2010.02.002. Epub 2010 Mar 2. Eur J Cell Biol. 2010. PMID: 20189679
-
In vivo dynamics of clathrin and its adaptor-dependent recruitment to the actin-based endocytic machinery in yeast.Dev Cell. 2005 Jul;9(1):87-98. doi: 10.1016/j.devcel.2005.04.014. Dev Cell. 2005. PMID: 15992543
-
Yeast Eps15-like endocytic protein Pan1p regulates the interaction between endocytic vesicles, endosomes and the actin cytoskeleton.Elife. 2016 Feb 25;5:e10276. doi: 10.7554/eLife.10276. Elife. 2016. PMID: 26914139 Free PMC article.
-
The budding yeast endocytic pathway.J Cell Sci. 2006 Nov 15;119(Pt 22):4585-7. doi: 10.1242/jcs.03251. J Cell Sci. 2006. PMID: 17093262 Review.
-
Actin in the endocytic pathway: from yeast to mammals.FEBS Lett. 2008 Jun 18;582(14):2112-9. doi: 10.1016/j.febslet.2008.04.011. Epub 2008 Apr 15. FEBS Lett. 2008. PMID: 18420037 Review.
Cited by
-
Fission yeast sec3 bridges the exocyst complex to the actin cytoskeleton.Traffic. 2012 Nov;13(11):1481-95. doi: 10.1111/j.1600-0854.2012.01408.x. Epub 2012 Sep 7. Traffic. 2012. PMID: 22891673 Free PMC article.
-
Gβ promotes pheromone receptor polarization and yeast chemotropism by inhibiting receptor phosphorylation.Sci Signal. 2016 Apr 12;9(423):ra38. doi: 10.1126/scisignal.aad4376. Sci Signal. 2016. PMID: 27072657 Free PMC article.
-
Zooming in on the molecular mechanisms of endocytic budding by time-resolved electron microscopy.Cell Mol Life Sci. 2014 Feb;71(4):641-57. doi: 10.1007/s00018-013-1452-8. Epub 2013 Sep 4. Cell Mol Life Sci. 2014. PMID: 24002236 Free PMC article. Review.
-
Eps15/Pan1p is a master regulator of the late stages of the endocytic pathway.J Cell Biol. 2022 Oct 3;221(10):e202112138. doi: 10.1083/jcb.202112138. Epub 2022 Aug 19. J Cell Biol. 2022. PMID: 35984332 Free PMC article.
-
Budding Yeast Has a Minimal Endomembrane System.Dev Cell. 2018 Jan 8;44(1):56-72.e4. doi: 10.1016/j.devcel.2017.12.014. Epub 2018 Jan 8. Dev Cell. 2018. PMID: 29316441 Free PMC article.
References
Publication types
MeSH terms
Substances
Grants and funding
LinkOut - more resources
Full Text Sources
Molecular Biology Databases
Miscellaneous

