

Insights into transcriptional regulation and sigma competition from an equilibrium model of RNA polymerase binding to DNA
- PMID: 16567622
- PMCID: PMC1459355
- DOI: 10.1073/pnas.0600828103
Insights into transcriptional regulation and sigma competition from an equilibrium model of RNA polymerase binding to DNA
Abstract
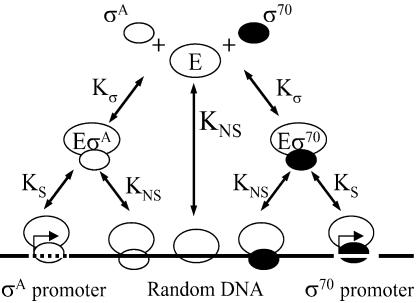
To explore scenarios that permit transcription regulation by activator recruitment of RNA polymerase and sigma competition in vivo, we used an equilibrium model of RNA polymerase binding to DNA constrained by the values of total RNA polymerase (E) and sigma(70) per cell measured in this work. Our numbers of E and sigma(70) per cell, which are consistent with most of the primary data in the literature, suggest that in vivo (i) only a minor fraction of RNA polymerase (<20%) is involved in elongation and (ii) sigma(70) is in excess of total E. Modeling the partitioning of RNA polymerase between promoters, nonspecific DNA binding sites, and the cytoplasm suggested that even weak promoters will be saturated with Esigma(70) in vivo unless nonspecific DNA binding by Esigma(70) is rather significant. In addition, the model predicted that sigmas compete for binding to E only when their total number exceeds the total amount of RNA polymerase (excluding that involved in elongation) and that weak promoters will be preferentially subjected to sigma competition.
Conflict of interest statement
Conflict of interest statement: No conflicts declared.
Figures


Similar articles
-
In vitro transcription profiling of the σS subunit of bacterial RNA polymerase: re-definition of the σS regulon and identification of σS-specific promoter sequence elements.Nucleic Acids Res. 2011 Jul;39(13):5338-55. doi: 10.1093/nar/gkr129. Epub 2011 Mar 11. Nucleic Acids Res. 2011. PMID: 21398637 Free PMC article.
-
Possible roles of σ-dependent RNA polymerase pausing in transcription regulation.RNA Biol. 2017 Dec 2;14(12):1678-1682. doi: 10.1080/15476286.2017.1356568. Epub 2017 Sep 13. RNA Biol. 2017. PMID: 28816625 Free PMC article. Review.
-
Modeling RNA polymerase competition: the effect of σ-subunit knockout and heat shock on gene transcription level.Biol Direct. 2011 Jan 21;6:3. doi: 10.1186/1745-6150-6-3. Biol Direct. 2011. PMID: 21255416 Free PMC article.
-
Sigma and RNA polymerase: an on-again, off-again relationship?Mol Cell. 2005 Nov 11;20(3):335-45. doi: 10.1016/j.molcel.2005.10.015. Mol Cell. 2005. PMID: 16285916 Review.
-
Novel protein--protein interaction between Escherichia coli SoxS and the DNA binding determinant of the RNA polymerase alpha subunit: SoxS functions as a co-sigma factor and redeploys RNA polymerase from UP-element-containing promoters to SoxS-dependent promoters during oxidative stress.J Mol Biol. 2004 Oct 22;343(3):513-32. doi: 10.1016/j.jmb.2004.08.057. J Mol Biol. 2004. PMID: 15465042
Cited by
-
Single-cell measurement of plasmid copy number and promoter activity.Nat Commun. 2021 Mar 5;12(1):1475. doi: 10.1038/s41467-021-21734-y. Nat Commun. 2021. PMID: 33674569 Free PMC article.
-
Mycobacterium tuberculosis RbpA protein is a new type of transcriptional activator that stabilizes the σ A-containing RNA polymerase holoenzyme.Nucleic Acids Res. 2012 Aug;40(14):6547-57. doi: 10.1093/nar/gks346. Epub 2012 May 8. Nucleic Acids Res. 2012. PMID: 22570422 Free PMC article.
-
Crl facilitates RNA polymerase holoenzyme formation.J Bacteriol. 2006 Nov;188(22):7966-70. doi: 10.1128/JB.01266-06. Epub 2006 Sep 15. J Bacteriol. 2006. PMID: 16980472 Free PMC article.
-
Growth-rate-dependent partitioning of RNA polymerases in bacteria.Proc Natl Acad Sci U S A. 2008 Dec 23;105(51):20245-50. doi: 10.1073/pnas.0804953105. Epub 2008 Dec 10. Proc Natl Acad Sci U S A. 2008. PMID: 19073937 Free PMC article.
-
Differential mechanisms of binding of anti-sigma factors Escherichia coli Rsd and bacteriophage T4 AsiA to E. coli RNA polymerase lead to diverse physiological consequences.J Bacteriol. 2008 May;190(10):3434-43. doi: 10.1128/JB.01792-07. Epub 2008 Mar 21. J Bacteriol. 2008. PMID: 18359804 Free PMC article.
References
-
- Gross C. A., Chan C., Dombroski A., Gruber T., Sharp M., Tupy J., Young B. Cold Spring Harbor Symp. Quant. Biol. 1998;63:141–155. - PubMed
-
- McClure W. R. Annu. Rev. Biochem. 1985;54:171–204. - PubMed
-
- Buc H., McClure W. R. Biochemistry. 1985;24:2712–2723. - PubMed
-
- Saecker R. M., Tsodikov O. V., McQuade K. L., Schlax P. E., Jr., Capp M. W., Record M. T., Jr. J. Mol. Biol. 2002;319:649–671. - PubMed
Publication types
MeSH terms
Substances
Grants and funding
LinkOut - more resources
Full Text Sources
Other Literature Sources
