

Receptor-receptor coupling in bacterial chemotaxis: evidence for strongly coupled clusters
- PMID: 16565056
- PMCID: PMC1471836
- DOI: 10.1529/biophysj.105.079905
Receptor-receptor coupling in bacterial chemotaxis: evidence for strongly coupled clusters
Abstract
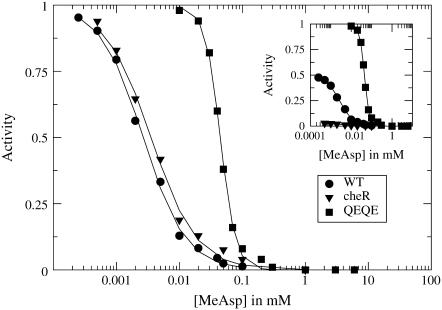
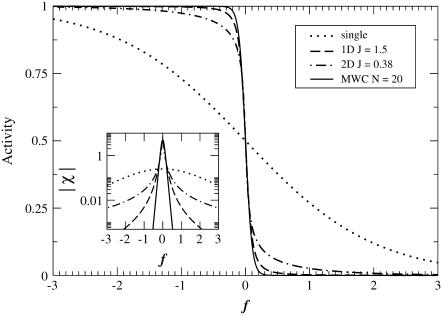
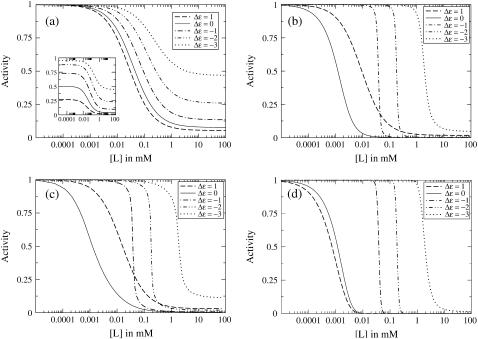
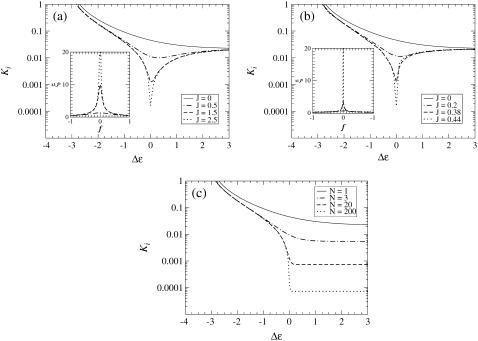
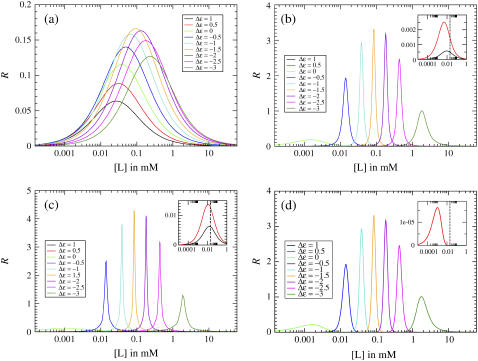
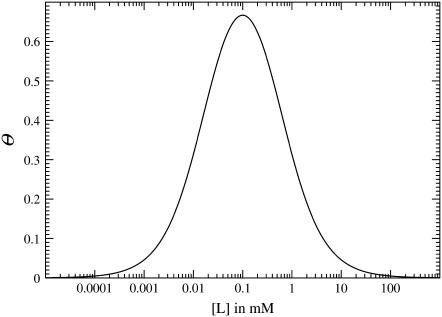
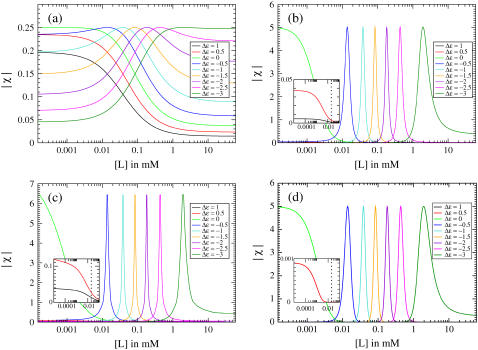
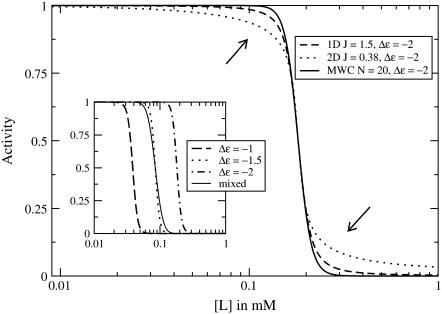
Receptor coupling is believed to explain the high sensitivity of the Escherichia coli chemotaxis network to small changes in levels of chemoattractant. We compare in detail the activity response of coupled two-state receptors for different models of receptor coupling: weakly-coupled extended one-dimensional and two-dimensional lattice models and the Monod-Wyman-Changeux model of isolated strongly-coupled clusters. We identify features in recent data that distinguish between the models. Specifically, researchers have measured the receptor activity response to steps of chemoattractant for a variety of engineered E. coli strains using in vivo fluorescence resonance energy transfer. We find that the fluorescence resonance energy transfer results for wild-type and for a low-activity mutant are inconsistent with the lattice models of receptor coupling, but consistent with the Monod-Wyman-Changeux model of receptor coupling, suggesting that receptors form isolated strongly-coupled clusters.
Figures
Similar articles
-
A dynamic-signaling-team model for chemotaxis receptors in Escherichia coli.Proc Natl Acad Sci U S A. 2010 Oct 5;107(40):17170-5. doi: 10.1073/pnas.1005017107. Epub 2010 Sep 20. Proc Natl Acad Sci U S A. 2010. PMID: 20855582 Free PMC article.
-
Chemotaxis receptor complexes: from signaling to assembly.PLoS Comput Biol. 2007 Jul;3(7):e150. doi: 10.1371/journal.pcbi.0030150. Epub 2007 Jun 16. PLoS Comput Biol. 2007. PMID: 17676982 Free PMC article.
-
Signaling noise enhances chemotactic drift of E. coli.Phys Rev Lett. 2012 Oct 5;109(14):148101. doi: 10.1103/PhysRevLett.109.148101. Epub 2012 Oct 2. Phys Rev Lett. 2012. PMID: 23083290
-
A hitchhiker's guide through advances and conceptual changes in chemotaxis.J Cell Physiol. 2007 Dec;213(3):574-80. doi: 10.1002/jcp.21238. J Cell Physiol. 2007. PMID: 17708539 Review.
-
Bacterial chemotaxis: a field in motion.Curr Opin Struct Biol. 1995 Dec;5(6):744-51. doi: 10.1016/0959-440x(95)80006-9. Curr Opin Struct Biol. 1995. PMID: 8749361 Review.
Cited by
-
A modular gradient-sensing network for chemotaxis in Escherichia coli revealed by responses to time-varying stimuli.Mol Syst Biol. 2010 Jun 22;6:382. doi: 10.1038/msb.2010.37. Mol Syst Biol. 2010. PMID: 20571531 Free PMC article.
-
Precise adaptation in bacterial chemotaxis through "assistance neighborhoods".Proc Natl Acad Sci U S A. 2006 Aug 29;103(35):13040-4. doi: 10.1073/pnas.0603101103. Epub 2006 Aug 21. Proc Natl Acad Sci U S A. 2006. PMID: 16924119 Free PMC article.
-
A minimal model for metabolism-dependent chemotaxis in Rhodobacter sphaeroides (†).Interface Focus. 2014 Dec 6;4(6):20140002. doi: 10.1098/rsfs.2014.0002. Interface Focus. 2014. PMID: 25485076 Free PMC article.
-
Chemotaxis in Escherichia coli: a molecular model for robust precise adaptation.PLoS Comput Biol. 2008 Jan;4(1):e1. doi: 10.1371/journal.pcbi.0040001. Epub 2007 Nov 20. PLoS Comput Biol. 2008. PMID: 18179279 Free PMC article.
-
Upward mobility and alternative lifestyles: a report from the 10th biennial meeting on Bacterial Locomotion and Signal Transduction.Mol Microbiol. 2009 Jul;73(1):5-19. doi: 10.1111/j.1365-2958.2009.06742.x. Epub 2009 Jun 1. Mol Microbiol. 2009. PMID: 19496930 Free PMC article.
References
Publication types
MeSH terms
Substances
LinkOut - more resources
Full Text Sources
Other Literature Sources
