. 2006 Mar 15;12(6):1883-96.
doi: 10.1158/1078-0432.CCR-05-1167.

Effects of HIV protease inhibitor ritonavir on Akt-regulated cell proliferation in breast cancer

Affiliations

Effects of HIV protease inhibitor ritonavir on Akt-regulated cell proliferation in breast cancer

Anjaiah Srirangam et al. Clin Cancer Res. .

Abstract

Purpose: These studies were designed to determine whether ritonavir inhibits breast cancer in vitro and in vivo and, if so, how.

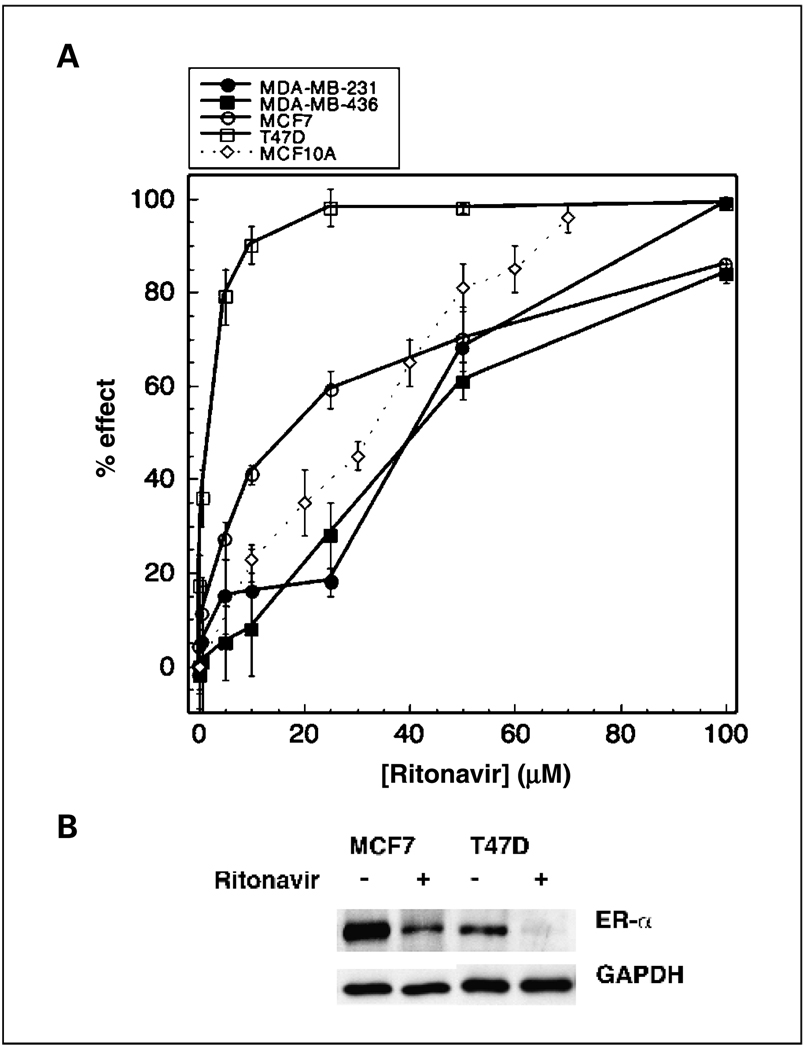
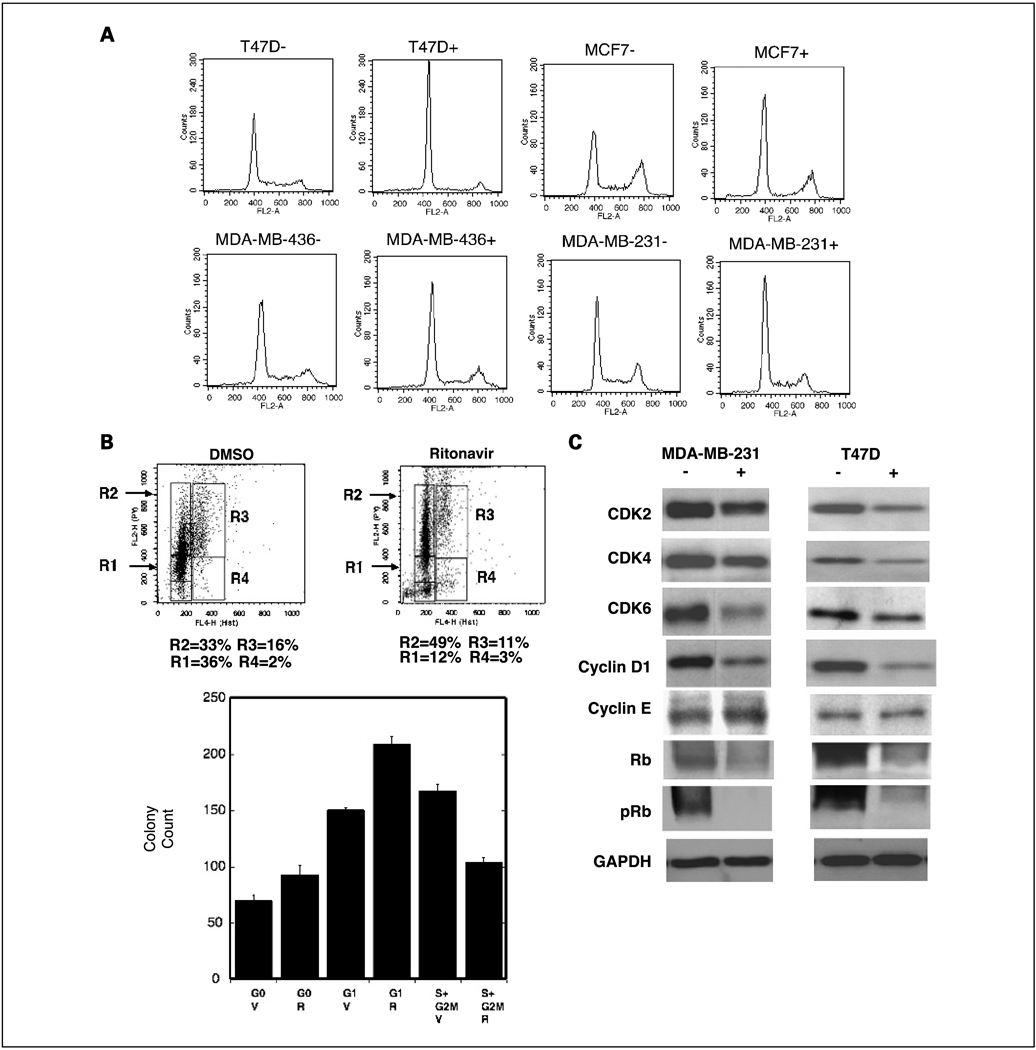
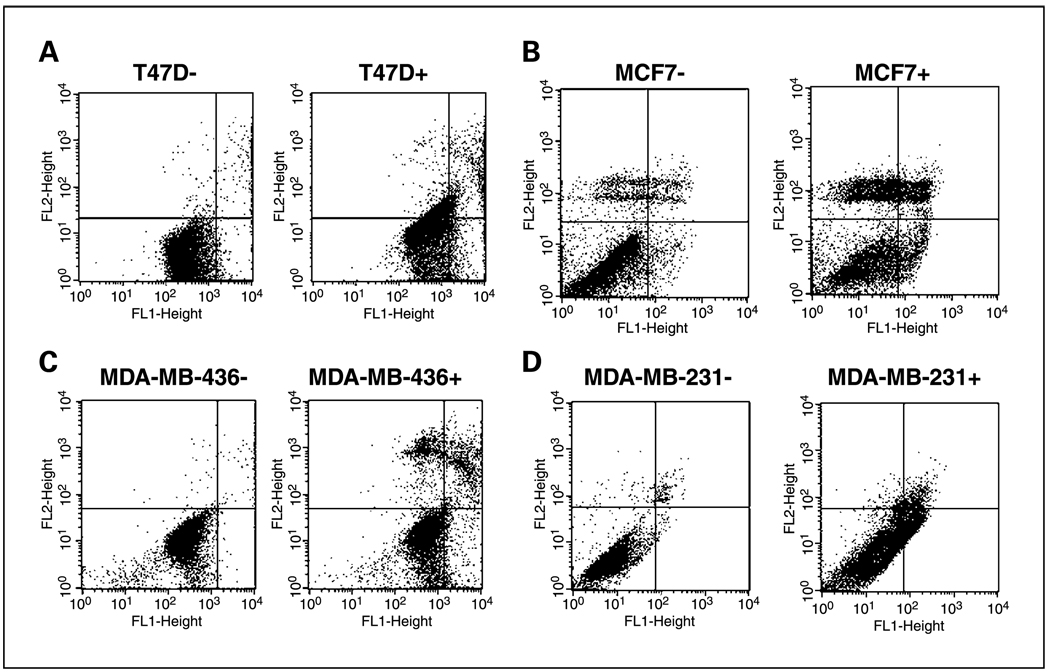
Experimental design: Ritonavir effects on breast cancer cell growth were studied in the estrogen receptor (ER)-positive lines MCF7 and T47D and in the ER-negative lines MDA-MB-436 and MDA-MB-231. Effects of ritonavir on Rb-regulated and Akt-mediated cell proliferation were studied. Ritonavir was tested for inhibition of a mammary carcinoma xenograft.

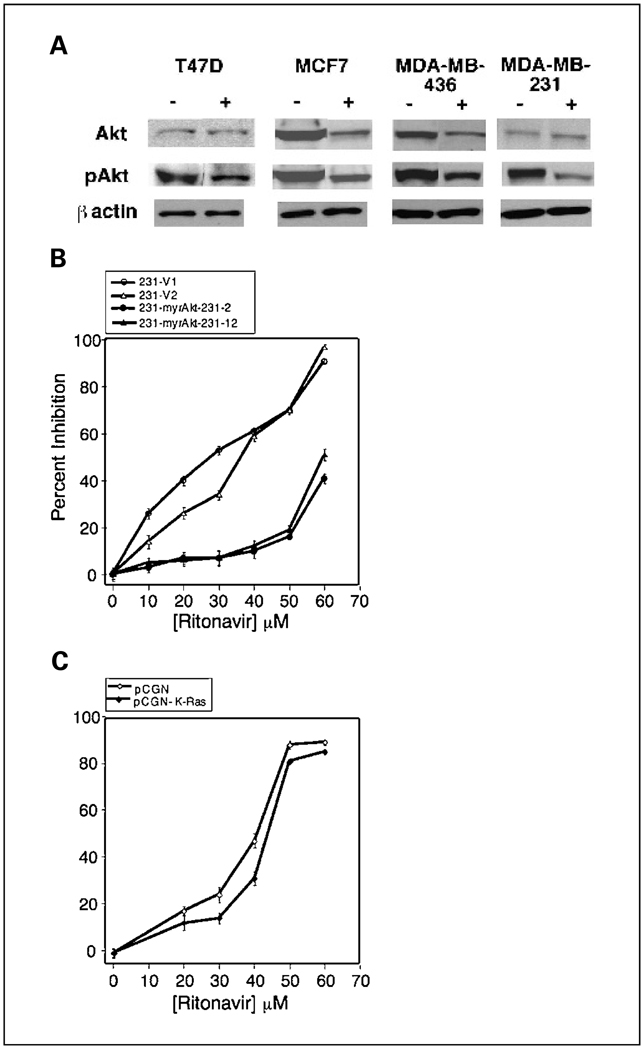
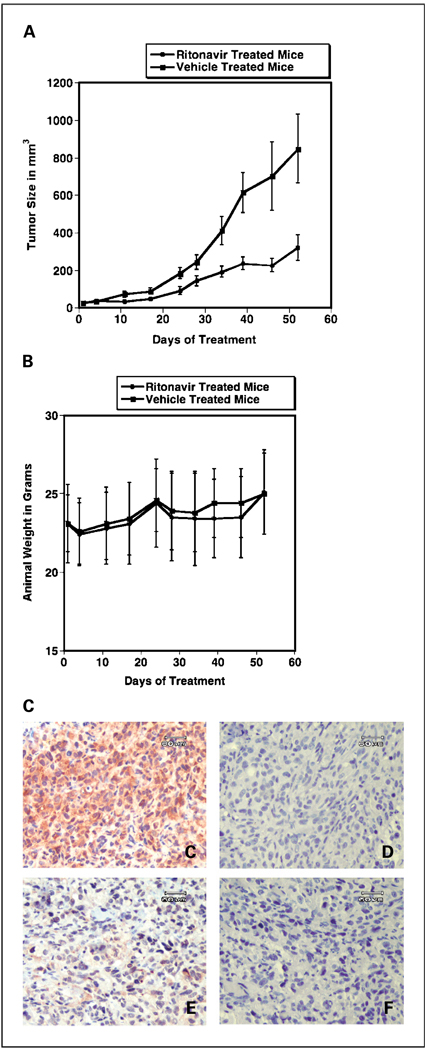
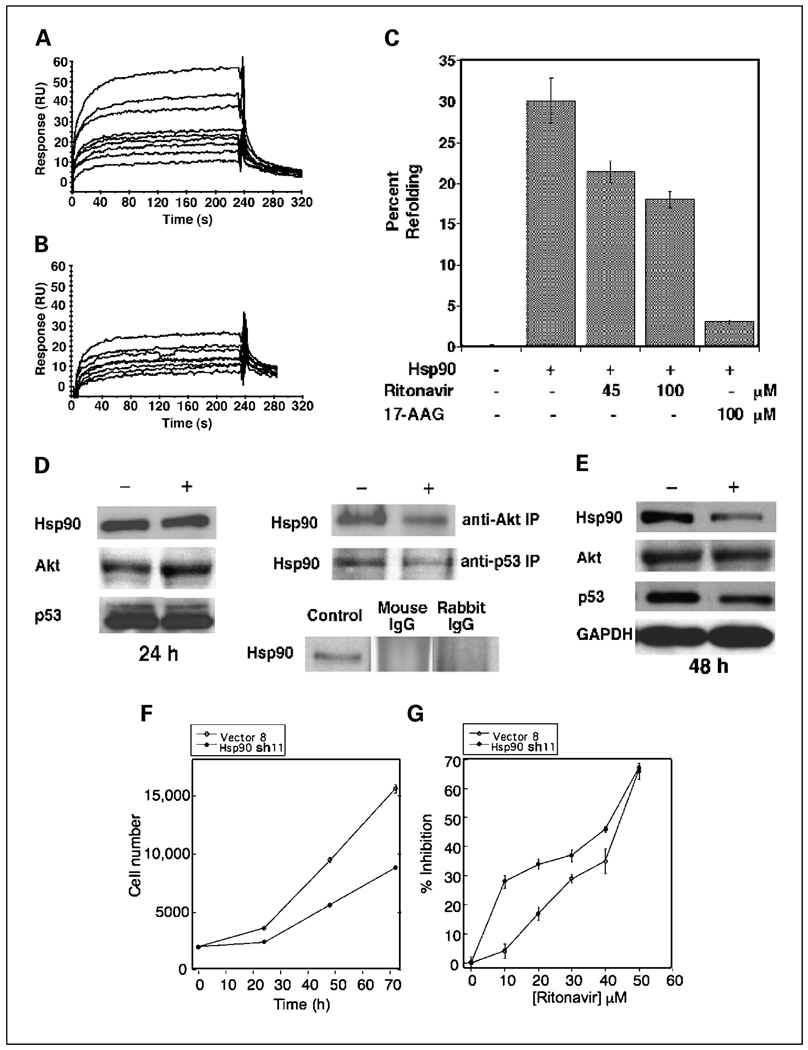
Results: ER-positive estradiol-dependent lines (IC50, 12-24 micromol/L) and ER-negative (IC50, 45 micromol/L) lines exhibit ritonavir sensitivity. Ritonavir depletes ER-alpha levels notably in ER-positive lines. Ritonavir causes G1 arrest, depletes cyclin-dependent kinases 2, 4, and 6 and cyclin D1 but not cyclin E, and depletes phosphorylated Rb and Ser473 Akt. Ritonavir induces apoptosis independent of G1 arrest, inhibiting growth of cells that have passed the G1 checkpoint. Myristoyl-Akt, but not activated K-Ras, rescues ritonavir inhibition. Ritonavir inhibited a MDA-MB-231 xenograft and intratumoral Akt activity at a clinically attainable serum Cmax of 22 +/- 8 micromol/L. Because heat shock protein 90 (Hsp90) substrates are depleted by ritonavir, ritonavir effects on Hsp90 were tested. Ritonavir binds Hsp90 (K(D), 7.8 micromol/L) and partially inhibits its chaperone function. Ritonavir blocks association of Hsp90 with Akt and, with sustained exposure, notably depletes Hsp90. Stably expressed Hsp90alpha short hairpin RNA also depletes Hsp90, inhibiting proliferation and sensitizing breast cancer cells to low ritonavir concentrations.

Conclusions: Ritonavir inhibits breast cancer growth in part by inhibiting Hsp90 substrates, including Akt. Ritonavir may be of interest for breast cancer therapeutics and its efficacy may be increased by sustained exposure or Hsp90 RNA interference.


Figures

Fig. 1
Fig. 1
Ritonavir inhibits the proliferation of breast cancer lines and causes a reduction of ER-α. A, ritonavir-mediated inhibition of growth ofT47D (□), MCF7 (○),MCF10A (◊), MDA-MB-436 (■), and MDA-MB-231 (●) cell lines was measured by MTTassay. Inhibition of cell growth in the presence of ritonavir is expressed as a percentage of a vehicle control at 48 hours of growth. Points, mean % inhibition; bars, SD. IC50s were determined from the plot. Representative of three experiments. B, ritonavir-mediated reduction of ER-α in the MCF7 and T47D lines after 48-hour exposure to ritonavir was measured by Western blot as described in Materials and Methods. Representative of three experiments. Protein measurements for each lane were normalized to the lane’s GAPDH control.
Fig. 2
Fig. 2
Ritonavir causes a G1 arrest of Rb+/+ breast cancer lines. A, flow cytometry analysis of PI staining of theT47D, MCF7, MDA-MB-436, and MDA-MB-231 lines at 48 hours of growth in the presence of DMSO vehicle (−) or ritonavir (+; 45 µmol/L). Representative of three experiments. Quantitation of PI flow cytometry is presented in Table 1. B, flow cytometry and clonogenic efficiency of sorted Hoechst/pyronin-stained MDA-MB-231cells.The cells were treated with ritonavir (IC50, 45 µmol/L) for 24 hours and then prepared for flow cytometry as described in Materials and Methods. Top, Hoechst dye (X axis) and pyronin (Y axis) staining. R1, G0; R2, G1; R3, S+G2−M; R4, sub-S + G2−M. Percentage of total cells in the R1 to R4 boxes is indicated below the flow cytometry plot. Bottom, colony recovery from the G0, G1, and S+ G2-M regions. The plating experiments were done in triplicate, with 250 cells plated per condition, and the cells were grown for 21days in the absence of ritonavir, with medium changed every 3 days. On day 21, the plates were stained with crystal violet and colonies were counted. V, vehicle; R, ritonavir treatment of the cells before plating. Bars, SD. Differences were significant between paired V and R cell populations for each region of the cell cycle (P < 0.05). C, ritonavir depletes CDK, cyclin D1, and pRb levels but not cyclin E in breast cancer lines. RIPA cell lysates were made from T47D or MDA-MB-231 lines treated for 24 hours with vehicle (−) or ritonavir (+) at the IC50 for proliferation (MDA-MB-231 = 45 µmol/L; T47D = 15 µmol/L). Lysate preparation and Western blot analysis were done as described in Materials and Methods. Quantitation of the Western blots is presented in Table 2. Protein measurements for each lane were normalized to the lane’s GAPDH control.
Fig. 3
Fig. 3
Ritonavir induces apoptosis in breast cancer lines. Flow cytometry of Annexin V-FITC (X axis)/PI (Y axis) staining of the (A) T47D, (B) MCF7, (C) MDA-MB-436 and (D) MDA-MB-231 lines at 48 hours of growth in the presence of vehicle (−) or ritonavir (+; 45 µmol/L). Quantitation of the quadrants of each plot is presented in Table 3.
Fig. 4
Fig. 4
Ritonavir-induced inhibition of pAkt. A, ritonavir-treated breast cancer lines exhibit reduction of pAkt. RIPA cell lysates were made from T47D, MCF7, MDA-MB-436, and MDA-MB-231 lines treated for 24 hours with vehicle (−) or ritonavir (+) at the IC50 for proliferation. Western blot analysis was done as described in Materials and Methods and normalized to a β-actin control. Quantitation is presented in Table 4. B, stable overexpression of constitutively activated myristoyl-Akt increases the ritonavir IC50 of the MDA-MB-231 line. Two vector control lines (○ and ∆) are compared with two m-(Δ4-129)-Akt lines (● and ▲). C, stable overexpression of K-Ras V12 fails to significantly increase the ritonavir IC50 of the MDA-MB-231 line. Results are derived from a vector clone (pCGN-V1) (◇) and pooled clonal lines stably transfected with K-RasV12 (pCGN-K-Ras) (♦).
Fig. 5
Fig. 5
Ritonavir inhibits a murine breast cancer xenograft and down-regulates intratumoral Akt activity. A, tumor growth curve for ritonavir-treated (●) or vehicle-treated (■) mice bearing MDA-MB-231 tumors. The difference between the curves exhibited statistical significance. Bars, SE (P < 0.001 by Student’s unpaired t test comparison of Gompertzian curve fits). B, weights were stable during treatment and similar for the ritonavir-treated (●) and vehicle-treated (■) mice. Points, mean animal weights Bars, SE. Method: A mammary fat pad model was used to test the response of xenograft tumors to ritonavir. A total of 1 × 10⁶ cells were injected in a surgically exposed right mammary fat pad under general anesthesia. Tumors were grown for 21 days before initiation of treatment. Mice were treated with 40 mg/kg/d ritonavir (n = 13) or vehicle (n = 14). C to F, Akt activity is depleted in the plasma membrane/cytoplasmic region of MDA-MB-231 tumor cells following ritonavir treatment. MDA-MB-231 tumors were resected on day 52 at the completion of the xenograft experiment in (A), 1 hour following ritonavir administration, and fixed in formalin. Micrograph images are of the paracortical region of the tumor containing tumor cells, confirmed by light microscopy and immunohistochemical analysis (data not shown). Immunohistochemical assay for Akt activity for vehicle (C) or ritonavir (E) xenograft treatment. Peptide competition using the Akt phosphorylation site phosphopeptide immunogen was done for the vehicle (D) and ritonavir (F) treatment conditions at 1:500 dilution (see Materials and Methods).The tumors of vehicle-treated mice exhibited a predominantly plasma membrane/cytoplasmic predominant pattern, whereas the tumors of ritonavir-treated mice exhibited a speckled nuclear predominant pattern. Reduction of Akt kinase activity was significant based on cell counts (P < 0.0001, Student’s t test).The ritonavir-treated tumors exhibit increased frequency of condensed and fragmented nuclei revealed in the peptide competition controls. Bar, 60 µm.
Fig. 6
Fig. 6
Ritonavir binds Hsp90, inhibits chaperone function and substrate association, depletes Hsp90 levels, and is potentiated by Hsp90α shRNA. A, surface plasmon resonance of ritonavir binding to purified HeLa cell Hsp90 attached to a Biacore CM5 sensor chip as described in Materials and Methods. Ritonavir was circulated in the flow cell at concentrations of 1, 4, 6, 8, 10, 12, 20, 25, and 37.5 µmol/L. Representative of three independent data sets. B, surface plasmon resonance of 17-AAG binding to purified HeLa cell Hsp90 attached to the same Biacore CM5 sensor chip as used in (A).The 17-AAG-positive control was circulated in the flow cell at concentrations of 0.6, 0.8, 3, 4, 5, 10, 20, and 35 µmol/L. Representative of three independent data sets. C, ritonavir inhibits ATP-dependent refolding of heat-treated luciferase. Heat-treated luciferase was refolded and assayed by luminometry in the presence of ATP and an ATP-regenerating system. Addition of Hsp90 (11 µmol/L), ritonavir, and/or17-AAG was done as indicated. Refolding was dependent on Hsp90 and ATP and significantly reduced relative to the Hsp90-positive control (column 2), with addition of ritonavir (45 or 100 µmol/L) or 17-AAG (100 µmol/L). Bars, SD (P < 0.05, Student’s t test for all comparisons with the Hsp90-positive control). D, ritonavir inhibits interaction of Hsp90 with Akt and mutant p53. Left, Hsp90, Akt, and mutant p53 levels are unaffected by ritonavir at 24 hours of treatment at the ritonavir IC50. MDA-MB-231 cells were treated with DMSO vehicle (−) or at the ritonavir IC50 (+) for 24 hours, and RIPA lysates were probed by Western blotting with antisera to Hsp90, Akt, or mutant p53. Experiments were done in triplicate. A GAPDH control for normalization of Western blots is not shown. Top right, ritonavir inhibits immunoprecipitation of associated Hsp90 by an anti-Akt or anti-p53 antibody. MDA-MB-231 cell extracts from cells treated with vehicle (−) or ritonavir (+) at the IC50 were subject to immunoprecipitation by an anti-Akt or anti-p53 antibody (see Materials and Methods) followed by Western blot analysis by a Hsp90 antibody. Equal proteinwas used for the ritonavir and vehicle immunoprecipitations. Representative of three independent experiments. Bottom right, rabbit nonimmune IgG and murine nonimmune IgG control antibodies did not immunoprecipitate Hsp90 from RIPA lysates of untreated MDA-MB-231 cells. A Hsp90-positive control to indicate the mobility of Hp90 is shown from the same blot. E, ritonavir treatment for 48 hours depletes Hsp90 and p53 but not Akt. MDA-MB-231 cells were treated with DMSO vehicle (−) or at the ritonavir IC50 (+) for 48 hours, and RIPA lysates were probed by Western blotting in triplicate. GAPDH values were used to normalize the Western blot quantitation. F, the MDA-MB-231 line is dependent on Hsp90 for proliferation. The sh11 line expressing Hsp90α shRNA (●) exhibits significantly slower proliferation by MTTassay compared with the vector control lineV8 (○). Points, mean of octuplicate measurements; bars, SE. G, RNA interference targeting Hsp90 causes decreased resistance to ritonavir at low ritonavir concentrations. The sh11 (●) or vector control lineV8 (○) were exposed to varying concentrations of ritonavir for 48 hours and proliferation was measured by MTTassay. Points, mean of octuplicate measurements; bars, SE.

Similar articles

Cited by

References

    1. Sledge GW, Neuberg D, Bernardo P, et al. Phase III trial of doxorubicin, paclitaxel, and the combination of doxorubicin and paclitaxel as front-line chemotherapy for metastatic breast cancer: an intergroup trial (E1193) J Clin Oncol. 2003;21:588–592. - PubMed
    1. Kempf DJ, Marsh KC, Denissen JF, et al. ABT-538 is a potent inhibitor of human immunodeficiency virus protease and has high oral bioavailability in humans. Proc Natl Acad Sci U S A. 1995;92:2484–2488. - PMC - PubMed
    1. Pati S, Pelser CB, Dufraine J, Bryant JL, Reitz MS, Jr., Weichold FF. Antitumorigenic effects of HIV protease inhibitor ritonavir: inhibition of Kaposi sarcoma. Blood. 2002;99:3771–3779. - PubMed
    1. Gaedicke S, Firat-Geier E, Constantiniu O, et al. Anti-tumor effect of the human immunodeficiency virus protease inhibitor ritonavir: induction of tumor-cell apoptosis associated with perturbation of proteasomal proteolysis. Cancer Res. 2002;62:6901–6908. - PubMed
    1. Laurent N, de Bouard S, Guillamo JS, et al. Effects of the proteasome inhibitor ritonavir on glioma growth in vitro and in vivo. Mol Cancer Ther. 2004;3:129–136. - PubMed

Publication types

MeSH terms