alphaE-catenin controls cerebral cortical size by regulating the hedgehog signaling pathway
- PMID: 16543460
- PMCID: PMC2556178
- DOI: 10.1126/science.1121449
alphaE-catenin controls cerebral cortical size by regulating the hedgehog signaling pathway
Abstract
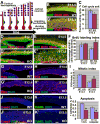
During development, cells monitor and adjust their rates of accumulation to produce organs of predetermined size. We show here that central nervous system-specific deletion of the essential adherens junction gene, alphaE-catenin, causes abnormal activation of the hedgehog pathway, resulting in shortening of the cell cycle, decreased apoptosis, and cortical hyperplasia. We propose that alphaE-catenin connects cell-density-dependent adherens junctions with the developmental hedgehog pathway and that this connection may provide a negative feedback loop controlling the size of developing cerebral cortex.
Figures


Comment in
-
Neuroscience. Neuron, know thy neighbor.Science. 2006 Mar 17;311(5767):1560-2. doi: 10.1126/science.1126397. Science. 2006. PMID: 16543446 No abstract available.
Similar articles
-
Neuroscience. Neuron, know thy neighbor.Science. 2006 Mar 17;311(5767):1560-2. doi: 10.1126/science.1126397. Science. 2006. PMID: 16543446 No abstract available.
-
Eppendorf & Science Prize. Essays on science and society. Making a bigger brain by regulating cell cycle exit.Science. 2002 Oct 25;298(5594):766-7. doi: 10.1126/science.1079328. Science. 2002. PMID: 12399574 No abstract available.
-
αE-Catenin Is a Positive Regulator of Pancreatic Islet Cell Lineage Differentiation.Cell Rep. 2017 Aug 8;20(6):1295-1306. doi: 10.1016/j.celrep.2017.07.035. Cell Rep. 2017. PMID: 28793255 Free PMC article.
-
The role of adherens junctions in the developing neocortex.Cell Adh Migr. 2015;9(3):167-74. doi: 10.1080/19336918.2015.1027478. Cell Adh Migr. 2015. PMID: 25914082 Free PMC article. Review.
-
N-cadherin-based adherens junction regulates the maintenance, proliferation, and differentiation of neural progenitor cells during development.Cell Adh Migr. 2015;9(3):183-92. doi: 10.1080/19336918.2015.1005466. Epub 2015 Apr 14. Cell Adh Migr. 2015. PMID: 25869655 Free PMC article. Review.
Cited by
-
Cadherin-mediated cell adhesion is critical for the closing of the mouse optic fissure.PLoS One. 2012;7(12):e51705. doi: 10.1371/journal.pone.0051705. Epub 2012 Dec 11. PLoS One. 2012. PMID: 23240058 Free PMC article.
-
α-Catenin inhibits β-catenin-T-cell factor/lymphoid enhancing factor transcriptional activity and collagen type II expression in articular chondrocytes through formation of Gli3R.α-catenin.β-catenin ternary complex.J Biol Chem. 2012 Apr 6;287(15):11751-60. doi: 10.1074/jbc.M111.281014. Epub 2012 Feb 1. J Biol Chem. 2012. PMID: 22298781 Free PMC article.
-
Biallelic loss of human CTNNA2, encoding αN-catenin, leads to ARP2/3 complex overactivity and disordered cortical neuronal migration.Nat Genet. 2018 Aug;50(8):1093-1101. doi: 10.1038/s41588-018-0166-0. Epub 2018 Jul 16. Nat Genet. 2018. PMID: 30013181 Free PMC article.
-
Catenins: keeping cells from getting their signals crossed.Dev Cell. 2006 Nov;11(5):601-12. doi: 10.1016/j.devcel.2006.10.010. Dev Cell. 2006. PMID: 17084354 Free PMC article. Review.
-
Subnuclear development of the zebrafish habenular nuclei requires ER translocon function.Dev Biol. 2011 Dec 1;360(1):44-57. doi: 10.1016/j.ydbio.2011.09.003. Epub 2011 Sep 16. Dev Biol. 2011. PMID: 21945073 Free PMC article.
References
-
- Chenn A, Zhang YA, Chang BT, McConnell SK. Mol Cell Neurosci. 1998 Jul;11:183. - PubMed
-
- Hirano S, Kimoto N, Shimoyama Y, Hirohashi S, Takeichi M. Cell. 1992 Jul 24;70:293. - PubMed
-
- Vasioukhin V, Bauer C, Yin M, Fuchs E. Cell. 2000 Jan 21;100:209. - PubMed
-
- Vasioukhin V, Bauer C, Degenstein L, Wise B, Fuchs E. Cell. 2001 Feb 23;104:605. - PubMed
-
- Graus-Porta D, et al. Neuron. 2001 Aug 16;31:367. - PubMed
Publication types
MeSH terms
Substances
Grants and funding
LinkOut - more resources
Full Text Sources
Other Literature Sources
Molecular Biology Databases

