Wiring optimization can relate neuronal structure and function
- PMID: 16537428
- PMCID: PMC1550972
- DOI: 10.1073/pnas.0506806103
Wiring optimization can relate neuronal structure and function
Abstract
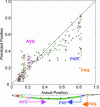
We pursue the hypothesis that neuronal placement in animals minimizes wiring costs for given functional constraints, as specified by synaptic connectivity. Using a newly compiled version of the Caenorhabditis elegans wiring diagram, we solve for the optimal layout of 279 nonpharyngeal neurons. In the optimal layout, most neurons are located close to their actual positions, suggesting that wiring minimization is an important factor. Yet some neurons exhibit strong deviations from "optimal" position. We propose that biological factors relating to axonal guidance and command neuron functions contribute to these deviations. We capture these factors by proposing a modified wiring cost function.
Conflict of interest statement
Conflict of interest statement: No conflicts declared.
Figures


Similar articles
-
Total Wiring Length Minimization of C. elegans Neural Network: A Constrained Optimization Approach.PLoS One. 2015 Dec 14;10(12):e0145029. doi: 10.1371/journal.pone.0145029. eCollection 2015. PLoS One. 2015. PMID: 26659722 Free PMC article.
-
Exact solution for the optimal neuronal layout problem.Neural Comput. 2004 Oct;16(10):2067-78. doi: 10.1162/0899766041732422. Neural Comput. 2004. PMID: 15333207
-
Wiring economy and volume exclusion determine neuronal placement in the Drosophila brain.Curr Biol. 2011 Dec 6;21(23):2000-5. doi: 10.1016/j.cub.2011.10.022. Epub 2011 Nov 23. Curr Biol. 2011. PMID: 22119527 Free PMC article.
-
Cellular and molecular mechanisms of synaptic specificity.Annu Rev Cell Dev Biol. 2014;30:417-37. doi: 10.1146/annurev-cellbio-100913-012953. Epub 2014 Aug 15. Annu Rev Cell Dev Biol. 2014. PMID: 25150010 Review.
-
Nematode neurons: anatomy and anatomical methods in Caenorhabditis elegans.Int Rev Neurobiol. 2006;69:1-35. doi: 10.1016/S0074-7742(05)69001-0. Int Rev Neurobiol. 2006. PMID: 16492460 Review. No abstract available.
Cited by
-
Compressed sensing based approach identifies modular neural circuitry driving learned pathogen avoidance.bioRxiv [Preprint]. 2024 Oct 17:2024.04.10.588911. doi: 10.1101/2024.04.10.588911. bioRxiv. 2024. PMID: 39464156 Free PMC article. Preprint.
-
Proprioceptive coupling within motor neurons drives C. elegans forward locomotion.Neuron. 2012 Nov 21;76(4):750-61. doi: 10.1016/j.neuron.2012.08.039. Neuron. 2012. PMID: 23177960 Free PMC article.
-
DBL-1, a TGF-β, is essential for Caenorhabditis elegans aversive olfactory learning.Proc Natl Acad Sci U S A. 2012 Oct 16;109(42):17081-6. doi: 10.1073/pnas.1205982109. Epub 2012 Sep 26. Proc Natl Acad Sci U S A. 2012. PMID: 23019581 Free PMC article.
-
The C. elegans Connectome Consists of Homogenous Circuits with Defined Functional Roles.PLoS Comput Biol. 2016 Sep 8;12(9):e1005021. doi: 10.1371/journal.pcbi.1005021. eCollection 2016 Sep. PLoS Comput Biol. 2016. PMID: 27606684 Free PMC article.
-
Optimally wired subnetwork determines neuroanatomy of Caenorhabditis elegans.Proc Natl Acad Sci U S A. 2007 Oct 23;104(43):17180-5. doi: 10.1073/pnas.0703183104. Epub 2007 Oct 17. Proc Natl Acad Sci U S A. 2007. PMID: 17942697 Free PMC article.
References
-
- Chalfie M. Curr. Opin. Genet. Dev. 1993;3:275–277. - PubMed
-
- Culotti J. G., Merz D. C. Curr. Opin. Cell Biol. 1998;10:609–613. - PubMed
-
- Wadsworth W. G., Hedgecock E. M. Curr. Opin. Neurobiol. 1992;2:36–41. - PubMed
-
- Tessier-Lavigne M., Goodman C. S. Science. 1996;274:1123–1133. - PubMed
-
- Dickson B. J. Science. 2002;298:1959–1964. - PubMed
Publication types
MeSH terms
Grants and funding
LinkOut - more resources
Full Text Sources
Other Literature Sources

