. 2006 Apr;18(4):893-906.
doi: 10.1105/tpc.105.039636. Epub 2006 Mar 3.

The D-type cyclin CYCD3;1 is limiting for the G1-to-S-phase transition in Arabidopsis

Affiliations

The D-type cyclin CYCD3;1 is limiting for the G1-to-S-phase transition in Arabidopsis

Margit Menges et al. Plant Cell. 2006 Apr.

Abstract

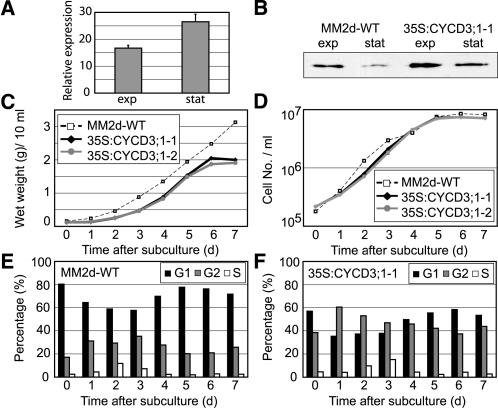
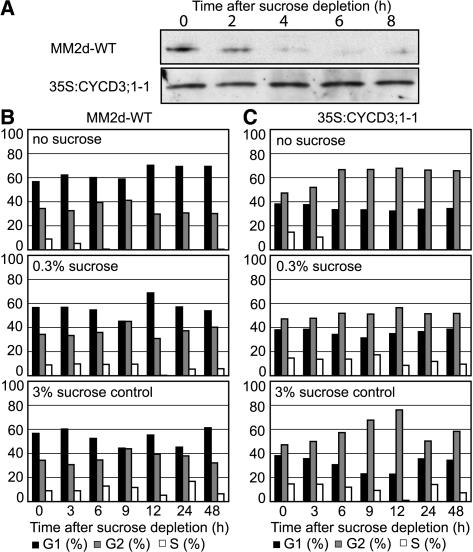
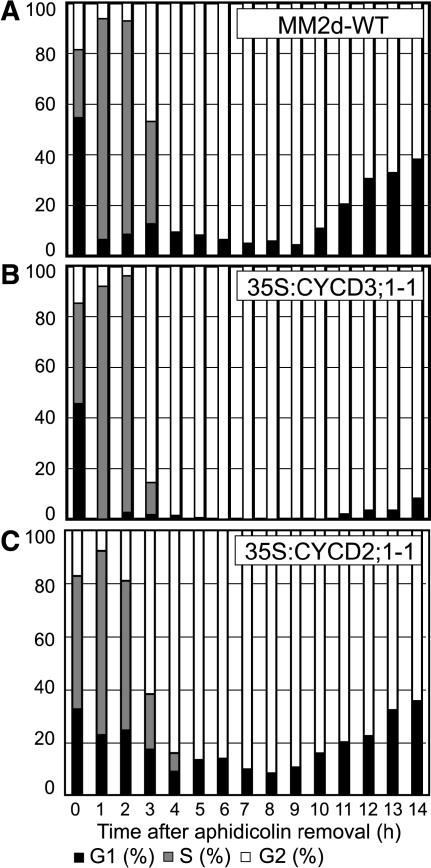
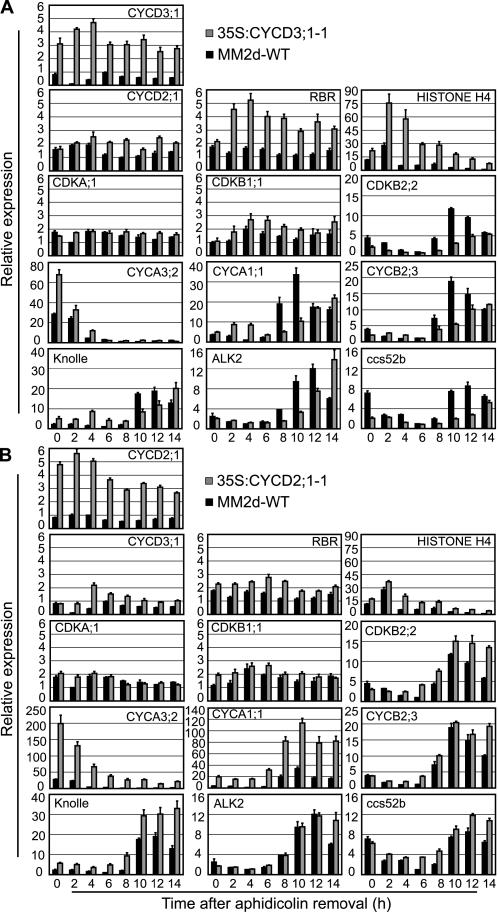
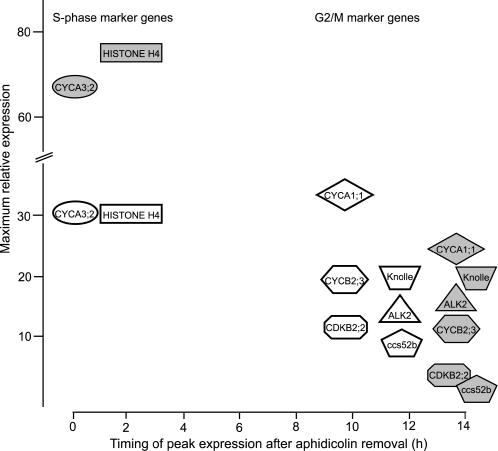
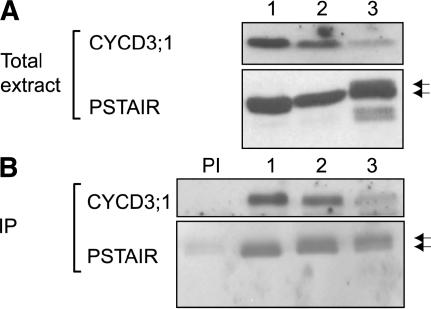
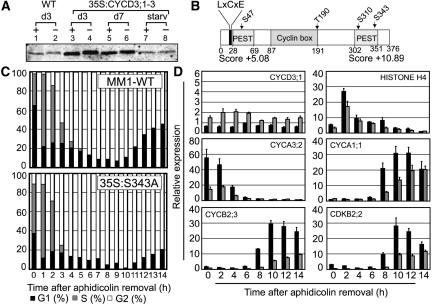
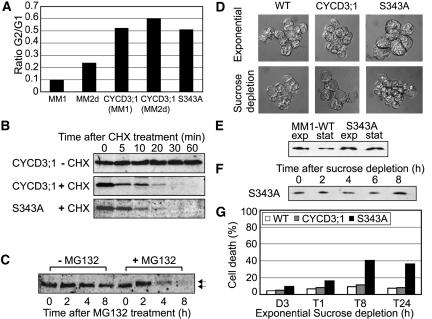
The G1-to-S-phase transition is a key regulatory point in the cell cycle, but the rate-limiting component in plants is unknown. Overexpression of CYCLIN D3;1 (CYCD3;1) in transgenic plants increases mitotic cycles and reduces endocycles, but its effects on cell cycle progression cannot be unambiguously determined. To analyze the cell cycle roles of plant D-type cyclins, we overexpressed CYCD3;1 in Arabidopsis thaliana cell suspension cultures. Changes in cell number and doubling time were insignificant, but cultures exhibited an increased proportion of G2- over G1-phase cells, as well as increased G2 arrest in response to stationary phase and sucrose starvation. Synchronized cultures confirm that CYCD3;1-expressing (but not CYCD2;1-expressing) cells show increased G2-phase length and delayed activation of mitotic genes such as B-type cyclins, suggesting that CYCD3;1 has a specific G1/S role. Analysis of putative cyclin-dependent kinase phosphorylation sites within CYCD3;1 shows that mutating Ser-343 to Ala enhances CYCD3;1 potency without affecting its rate of turnover and results in a fivefold increase in the level of cell death in response to sucrose removal. We conclude that CYCD3;1 dominantly drives the G1/S transition, and in sucrose-depleted cells the decline in CYCD3;1 levels leads to G1 arrest, which is overcome by ectopic CYCD3;1 expression. Ser-343 is likely a key residue in modulating CYCD3;1 activity in response to sucrose depletion.


Figures

Figure 1.
Figure 1.
Characterization of 35S:CYCD3;1 Arabidopsis Cell Lines. Early stationary phase cells (7 d after subculture) were transferred into fresh medium, and samples were taken for analysis after the days indicated. (A) Real time RT-PCR analysis to detect increased abundance of CYCD3;1 RNA in cell line 35S:CYCD3;1-1, presented as relative expression to the wild type (MM2d, baseline) during exponential growth (exp; day 3) and early stationary phase (stat; day 7). Error bars indicate sem; n = 4. (B) Protein gel blot analysis of CYCD3;1 protein during exponential growth (exp; day 3) and early stationary phase (stat; day 7) in the cell lines indicated. (C) and (D) Determination of biomass (wet weight) (C) and cell density (D) each day after dilution. (E) and (F) Flow cytometry analysis to monitor changes in DNA distribution during growth in the wild type (E) and transgenic 35S:CYCD3;1-1 (F). The percentages of cells in G1 (black bars), G2 (gray bars), and S (white bars) are shown.
Figure 2.
Figure 2.
Effect of Ectopic CYCD3;1 Expression on Cell Cycle Response to Sucrose Depletion. (A) Midexponentially growing cells (day 3) were washed twice in MS medium (lacking sucrose; see Methods), resuspended, and diluted into MS medium (dilution, 1:5). For protein gel blot analysis of CYCD3;1, samples were taken every 2 h in the cell lines indicated. (B) and (C) Midexponentially growing cells (day 3) were washed twice in MS medium (lacking sucrose), resuspended, and diluted in MS medium containing no sucrose, 0.3% sucrose, or 3% sucrose (dilution, 1:5). The arrest of cell cycle activity on sucrose depletion and change in DNA distribution was monitored by flow cytometry in wild-type (B) and transgenic 35S:CYCD3;1-1 (C) cells. The percentages of cells in G1 (black bars), G2 (gray bars), and S (white bars) are shown.
Figure 3.
Figure 3.
Cell Cycle Progression in Arabidopsis Cell Lines after Aphidicolin-Induced Synchrony. Cells were treated for 21 h with aphidicolin, and after release of the block, the synchronous progression of cells was monitored by flow cytometry in wild-type (A), 35S:CYCD3;1 (B), and 35S:CYCD2;1 (C) cells. The percentages of cells in G1 (black bars), G2 (white bars), and S (gray bars) are represented as DNA histograms.
Figure 4.
Figure 4.
35S:CYCD3;1 Delays the Activation of G2/M-Phase Genes. Expression of the genes indicated using RNA prepared from the synchronized cell samples in Figure 3 was monitored by quantitative RT-PCR using Actin-2 as an internal control. Error bars indicate se; n = 4. (A) Relative expression of genes in line 35S:CYCD3;1-1 compared with the wild type (MM2d) relative to the lowest expression observed in the experiment, except CYCD3;1, which is presented relative to the maximum wild-type expression (wild type, black bars; 35S:CYCD3;1-1, gray bars). (B) Relative expression of genes in line 35S:CYCD2;1-1 compared with the wild type (MM2d) as for (A) (wild-type, black bars; 35S:CYCD2;1-1, gray bars).
Figure 5.
Figure 5.
Summary of Data from Figure 4. Expression of selected cell cycle marker genes in cell line 35S:CYCD3;1-1 (gray symbols) compared with the wild type (white symbols). The genes are indicated at the time of their peak expression and positioned according to their fold increase in expression over the minimum level observed in wild-type cells. In particular, the higher expression of the S-phase genes HISTONE H4 and CYCA3;2 and the later expression of G2/M genes in 35S:CYCD3;1 cells is apparent.
Figure 6.
Figure 6.
Constitutively Expressed CYCD3;1 Interacts with CDKA;1. Total protein extracted from 35S:CYCD3;1-3 was analyzed by protein gel blot analysis (A) and immunoprecipitation (B). (A) Protein gel blot analysis using anti-CYCD3;1 antibody (Healy et al., 2001) and CDKA (using an anti-PSTAIRE monoclonal antibody). Lane 1, exponentially growing cells (day 3); lane 2, early stationary phase cells (day 7); lane 3, 24 h after sucrose starvation of exponentially growing cells (day 3). (B) Immunoprecipitation (IP) of CYCD3;1 followed by protein gel blot detection of CYCD3;1 and CDKA (PSTAIRE). PI, preimmune serum with protein extracts of sample 1. Lanes 1 to 3 are as in (A).
Figure 7.
Figure 7.
CYCD3;1 Is a Constitutive Phosphoprotein. (A) Protein extracts of wild-type and 35S:CYCD3;1 Arabidopsis cell lines were treated with λ protein phosphatase. CYCD3;1 was detected by protein gel blot analysis in treated (+) and untreated (−) samples of exponentially growing cells (day 3 [d3]; lanes 1 to 4), early stationary phase cells (day 7 [d7]; lanes 5 and 6), and after 24 h of sucrose removal from the medium of exponentially growing cells (starv; lanes 7 and 8). (B) Scheme of the CYCD3;1 sequence. Important domains and positions of mutated residues are highlighted. The LxCxE motif at the N terminus is necessary for binding to RB (Huntley et al., 1998), and PEST sequences with PESTfind scores are indicated. (C) Cell cycle progression in Arabidopsis wild type and mutant cell line CYCD3-S343A (35S:S343A) after aphidicolin-induced synchrony. Cells were treated for 21 h with aphidicolin, and after release of the block, the synchronous progression of cells was monitored by flow cytometry. The percentages of cells in G1 (black bars), G2 (white bars), and S (gray bars) are represented as DNA histograms. (D) Mutation of CYCD3-S343A (35S:S343A) results in a delay of activation of G2/M genes. Expression of the genes indicated was monitored by quantitative RT-PCR using Actin-2 as an internal control, shown as described in the legend to Figure 4A. Relative expression of mutant cell line 35S:S343A compared with the wild type (MM1) is shown relative to the lowest expression observed, except for CYCD3;1, which is presented relative to the maximum wild-type expression (wild type, black bars; 35S:S343A, gray bars). Error bars indicate se; n = 4.
Figure 8.
Figure 8.
Characterization of CYCD3;1 Mutant S343A. (A) Flow cytometry analysis of early stationary phase cells (day 7) in the cell lines indicated, presented as the relative distribution of G1:G2 cells in the population and showing the greater propensity of CYCD3;1– and CYCD3;1-S343A–expressing cells to exit division in G2-phase. (B) Cells expressing CYCD3;1 or CYCD3;1-S343A were incubated with (+) or without (−) cycloheximide (CHX) for the times indicated, and extracts were analyzed by immunoblotting with anti-CYCD3;1 antibody. (C) Exponentially growing cells from line CYCD3-S343A (day 4) were washed twice with MS medium to remove sucrose, resuspended, and treated with (+MG132) or in the absence of (−MG132) 100 μM MG132 for the times indicated. After protein extraction, CYCD3;1 was detected by protein gel blot analysis. Normal and hyperphosphorylated bands were detected for CYCD3-S343A, as observed previously with similar kinetics for wild-type CYCD3;1 (Planchais et al., 2004). (D) Cell morphology in exponentially growing cells (day 3; top) and after 24 h of sucrose depletion (bottom) in the wild type (MM1), 35S:CYCD3;1, and CYCD3-S343A. (E) Protein gel blot analysis of CYCD3;1 during exponential growth (exp; day 3) and early stationary phase (stat; day 7) in the cell lines indicated. (F) Midexponentially growing cells of line 35S:S343A (day 3) were washed twice in MS medium (lacking sucrose), resuspended, and diluted in MS medium (dilution, 1:5) as described for Figure 2A. For protein gel blot analysis of CYCD3;1, samples were taken every 2 h. (G) Effect of ectopic CYCD3;1 expression on viability in response to sucrose depletion. Midexponentially growing cells (day 3) were washed twice in MS medium (lacking sucrose), resuspended, and diluted in medium containing no sucrose (dilution, 1:5). Samples were taken as indicated and subjected to trypan blue staining to determine the percentage of dead or dying cells.

Similar articles

Cited by

References

    1. Araki, S., Ito, M., Soyano, T., Nishihama, R., and Machida, Y. (2004). Mitotic cyclins stimulate the activity of c-Myb-like factors for transactivation of G(2)/M-phase-specific genes in tobacco. J. Biol. Chem. 279 32979–32988. - PubMed
    1. Barroco, R.M., Van Poucke, K., Bergervoet, J.H.W., De Veylder, L., Groot, S.P.C., Inze, D., and Engler, G. (2005). The role of the cell cycle machinery in resumption of postembryonic development. Plant Physiol. 137 127–140. - PMC - PubMed
    1. Boonstra, J. (2003). Progression through the G(1)-phase of the on-going cell cycle. J. Cell. Biochem. 90 244–252. - PubMed
    1. Boucheron, E., Healy, J.M.S., Bajon, C., Sauvanet, A., Rembur, J., Noin, M., Sekine, M., Riou-Khamlichi, C., Murray, J.A.H., Van Onckelen, H., and Chriqui, D. (2005). Ectopic expression of Arabidopsis CycD2 and CycD3 in tobacco has distinct effects on the structural organization of the shoot apical meristem. J. Exp. Bot. 56 123–134. - PubMed
    1. Cockcroft, C.E., den Boer, B.G., Healy, J.M., and Murray, J.A.H. (2000). Cyclin D control of growth rate in plants. Nature 405 575–579. - PubMed

Publication types

MeSH terms