A simple method for assessing sample sizes in microarray experiments
- PMID: 16512900
- PMCID: PMC1450307
- DOI: 10.1186/1471-2105-7-106
A simple method for assessing sample sizes in microarray experiments
Abstract
Background: In this short article, we discuss a simple method for assessing sample size requirements in microarray experiments.
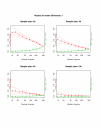
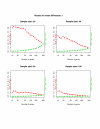
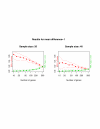
Results: Our method starts with the output from a permutation-based analysis for a set of pilot data, e.g. from the SAM package. Then for a given hypothesized mean difference and various samples sizes, we estimate the false discovery rate and false negative rate of a list of genes; these are also interpretable as per gene power and type I error. We also discuss application of our method to other kinds of response variables, for example survival outcomes.
Conclusion: Our method seems to be useful for sample size assessment in microarray experiments.
Figures


Similar articles
-
A mixture model approach to sample size estimation in two-sample comparative microarray experiments.BMC Bioinformatics. 2008 Feb 25;9:117. doi: 10.1186/1471-2105-9-117. BMC Bioinformatics. 2008. PMID: 18298817 Free PMC article.
-
Assessing differential gene expression with small sample sizes in oligonucleotide arrays using a mean-variance model.Biometrics. 2007 Mar;63(1):41-9. doi: 10.1111/j.1541-0420.2006.00675.x. Biometrics. 2007. PMID: 17447928
-
A bootstrap test for the analysis of microarray experiments with a very small number of replications.Appl Bioinformatics. 2006;5(3):173-9. doi: 10.2165/00822942-200605030-00005. Appl Bioinformatics. 2006. PMID: 16922598
-
Sample size for FDR-control in microarray data analysis.Bioinformatics. 2005 Jul 15;21(14):3097-104. doi: 10.1093/bioinformatics/bti456. Epub 2005 Apr 21. Bioinformatics. 2005. PMID: 15845654
-
Practical FDR-based sample size calculations in microarray experiments.Bioinformatics. 2005 Aug 1;21(15):3264-72. doi: 10.1093/bioinformatics/bti519. Epub 2005 Jun 2. Bioinformatics. 2005. PMID: 15932903
Cited by
-
Design and evaluation of Actichip, a thematic microarray for the study of the actin cytoskeleton.BMC Genomics. 2007 Aug 29;8:294. doi: 10.1186/1471-2164-8-294. BMC Genomics. 2007. PMID: 17727702 Free PMC article.
-
Power and sample size estimation in microarray studies.BMC Bioinformatics. 2010 Jan 25;11:48. doi: 10.1186/1471-2105-11-48. BMC Bioinformatics. 2010. PMID: 20100337 Free PMC article.
-
Variability of DNA microarray gene expression profiles in cultured rat primary hepatocytes.Gene Regul Syst Bio. 2007 Nov 18;1:235-49. Gene Regul Syst Bio. 2007. PMID: 19936092 Free PMC article.
-
Bacteroides in the infant gut consume milk oligosaccharides via mucus-utilization pathways.Cell Host Microbe. 2011 Nov 17;10(5):507-14. doi: 10.1016/j.chom.2011.10.007. Epub 2011 Oct 27. Cell Host Microbe. 2011. PMID: 22036470 Free PMC article.
-
Gene expression changes in the olfactory bulb of mice induced by exposure to diesel exhaust are dependent on animal rearing environment.PLoS One. 2013 Aug 5;8(8):e70145. doi: 10.1371/journal.pone.0070145. Print 2013. PLoS One. 2013. PMID: 23940539 Free PMC article.
References
-
- Gilbert Chu, Balasubramanian Narasimhan, Robert Tibshirani, Virginia Tusher. Significance analysis of microarrays (sam) software http://www-stat.stanford.edu/~tibs/SAM/ via the Internet. Accessed 2003 July 16 2002.
-
- Muller P, Parmigiani G, Robert C, Rousseau J. Optimal sample size for multiple testing: the case of gene expression microarrays. J Amer Statist Assoc. 2005;99:990–1001. doi: 10.1198/016214504000001646. - DOI
Publication types
MeSH terms
Grants and funding
LinkOut - more resources
Full Text Sources

