

Lineage specification and plasticity in CD19- early B cell precursors
- PMID: 16505143
- PMCID: PMC2118241
- DOI: 10.1084/jem.20052444
Lineage specification and plasticity in CD19- early B cell precursors
Abstract
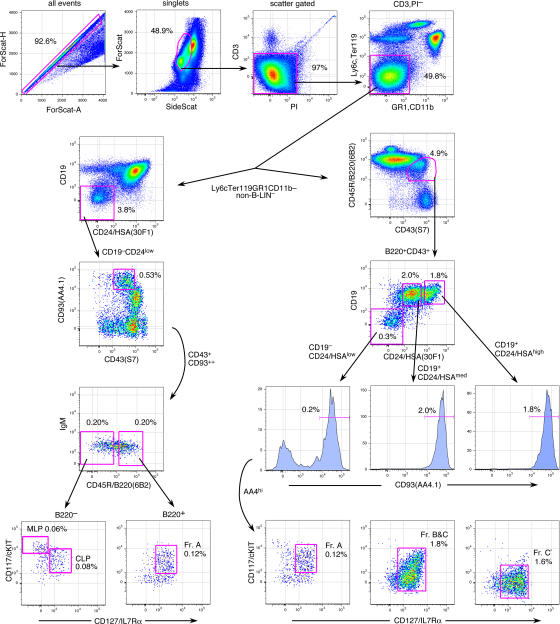
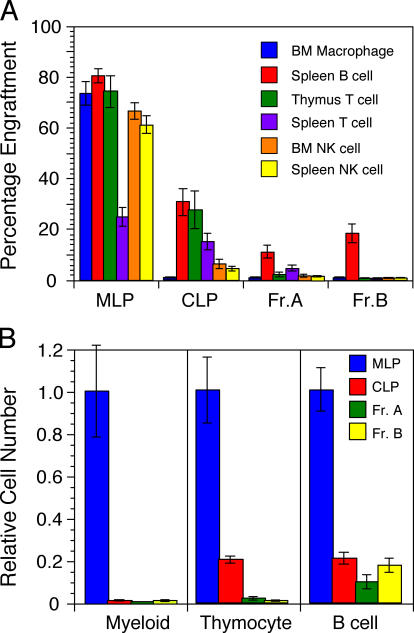
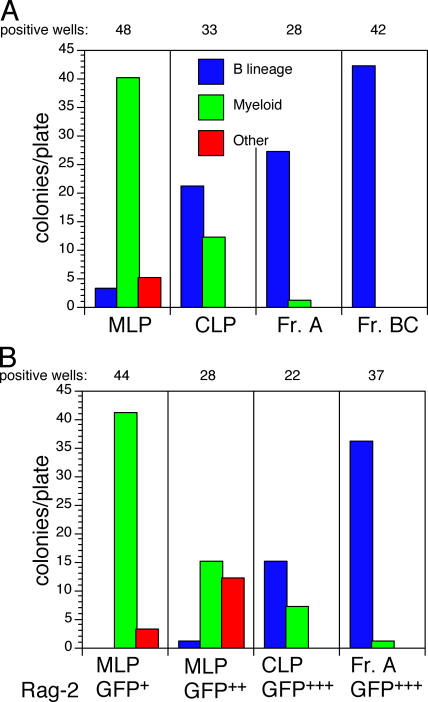
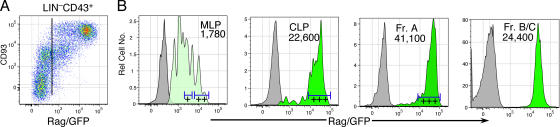
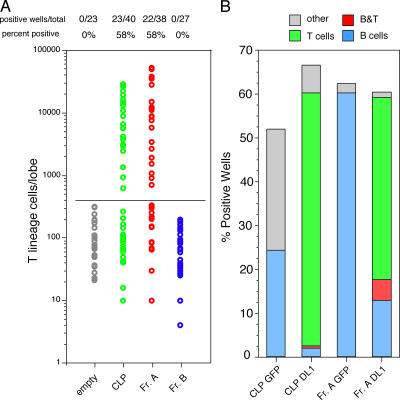
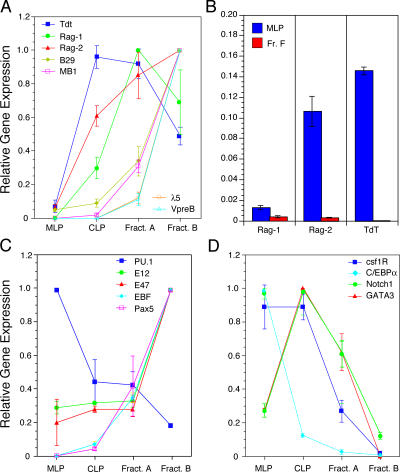
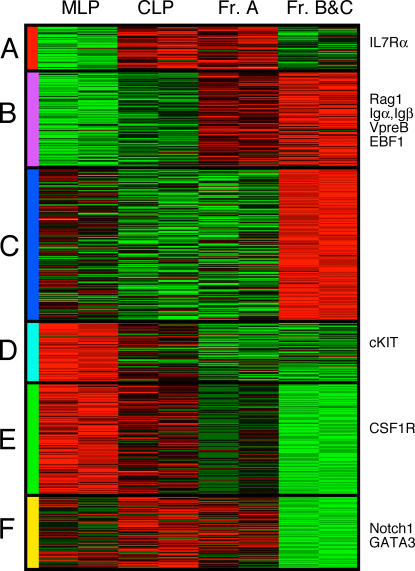
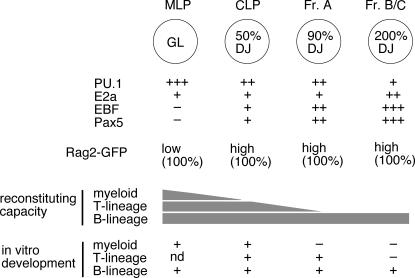
We describe here three CD19- B cell precursor populations in mouse bone marrow identified using 12-color flow cytometry. Cell transfer experiments indicate lineage potentials consistent with multilineage progenitor (MLP), common lymphoid progenitor (CLP), and B lineage-restricted pre-pro-B (Fr. A), respectively. However, single cell in vitro assays reveal lineage plasticity: lymphoid/myeloid lineage potential for CLP and B/T lineage potential for Fr. A. Despite myeloid potential, recombination activating gene 2 reporter activation is first detected at low levels in most MLP cells, with 95% of CLPs showing 10-fold increased levels. Furthermore, single cell analysis shows that half of CLP and 90% of Fr. A cells contain heavy chain DJ rearrangements. These data, together with expression profiles of lineage-specific genes, demonstrate progressive acquisition of B lineage potential and support an asynchronous view of early B cell development, in which B lineage specification initiates in the MLP/CLP stage, whereas myeloid potential is not lost until the pre-pro-B (Fr. A) stage, and B/T lymphoid plasticity persists until the CD19+ pro-B stage. Thus, MLP, CLP, and Fr. A represent progressively B lineage-specified stages in development, before the CD19+ B lineage-committed pro-B stage.
Figures
Similar articles
-
Ordering human CD34+CD10-CD19+ pre/pro-B-cell and CD19- common lymphoid progenitor stages in two pro-B-cell development pathways.Proc Natl Acad Sci U S A. 2010 Mar 30;107(13):5925-30. doi: 10.1073/pnas.0907942107. Epub 2010 Mar 15. Proc Natl Acad Sci U S A. 2010. PMID: 20231472 Free PMC article.
-
Fidelity and infidelity in commitment to B-lymphocyte lineage development.Immunol Rev. 2000 Jun;175:104-11. Immunol Rev. 2000. PMID: 10933595 Review.
-
Asynchronous RAG-1 expression during B lymphopoiesis.J Immunol. 2009 Dec 15;183(12):7768-77. doi: 10.4049/jimmunol.0902333. J Immunol. 2009. PMID: 20007571 Free PMC article.
-
Chronic B cell deficiency from birth prevents age-related alterations in the B lineage.J Immunol. 2011 Sep 1;187(5):2140-7. doi: 10.4049/jimmunol.1100999. Epub 2011 Aug 1. J Immunol. 2011. PMID: 21810615
-
Essential functions of Pax-5 (BSAP) in pro-B cell development.Immunobiology. 1997 Dec;198(1-3):227-35. doi: 10.1016/S0171-2985(97)80043-5. Immunobiology. 1997. PMID: 9442394 Review.
Cited by
-
Newly identified Gon4l/Udu-interacting proteins implicate novel functions.Sci Rep. 2020 Aug 26;10(1):14213. doi: 10.1038/s41598-020-70855-9. Sci Rep. 2020. PMID: 32848183 Free PMC article.
-
GATA-3 regulates hematopoietic stem cell maintenance and cell-cycle entry.Blood. 2012 Mar 8;119(10):2242-51. doi: 10.1182/blood-2011-07-366070. Epub 2012 Jan 20. Blood. 2012. PMID: 22267605 Free PMC article.
-
Control of B cell development by the histone H2A deubiquitinase MYSM1.Immunity. 2011 Dec 23;35(6):883-96. doi: 10.1016/j.immuni.2011.11.010. Epub 2011 Dec 8. Immunity. 2011. PMID: 22169041 Free PMC article.
-
The in vitro derivation of phenotypically mature and diverse B cells from immature spleen and bone marrow precursors.Eur J Immunol. 2010 Apr;40(4):1139-49. doi: 10.1002/eji.200939661. Eur J Immunol. 2010. PMID: 20077404 Free PMC article.
-
Unbiased quantification of immunoglobulin diversity at the DNA level with VDJ-seq.Nat Protoc. 2018 Jun;13(6):1232-1252. doi: 10.1038/nprot.2018.021. Epub 2018 May 3. Nat Protoc. 2018. PMID: 29725123
References
-
- Hardy, R.R. 2003. B-lymphocyte development and biology. In Fundamental Immunology. W.E. Paul, editor. Lippincott Williams & Wilkins, Philadelphia. 159–194.
-
- Busslinger, M. 2004. Transcriptional control of early B cell development. Annu. Rev. Immunol. 22:55–79. - PubMed
-
- Melchers, F., D. Haasner, U. Grawunder, C. Kalberer, H. Karasuyama, T. Winkler, and A.G. Rolink. 1994. Roles of IgH and L chains in the development of cells of the B lymphocyte lineage. Annu. Rev. Immunol. 12:209–225. - PubMed
-
- Hardy, R.R., and K. Hayakawa. 2001. B cell development pathways. Annu. Rev. Immunol. 19:595–621. - PubMed
-
- Li, Y.S., R. Wasserman, K. Hayakawa, and R.R. Hardy. 1996. Identification of the earliest B lineage stage in mouse bone marrow. Immunity. 5:527–535. - PubMed
Publication types
MeSH terms
Substances
Grants and funding
LinkOut - more resources
Full Text Sources
Medical
Miscellaneous
