Role of unfolded state heterogeneity and en-route ruggedness in protein folding kinetics
- PMID: 16501227
- PMCID: PMC2249777
- DOI: 10.1110/ps.051758206
Role of unfolded state heterogeneity and en-route ruggedness in protein folding kinetics
Abstract
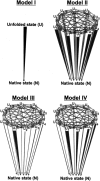
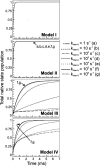
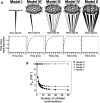
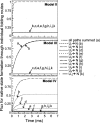
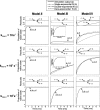
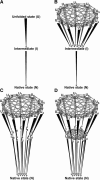
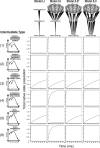
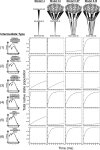
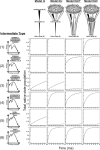
In order to improve our understanding of the physical bases of protein folding, there is a compelling need for better connections between experimental and computational approaches. This work addresses the role of unfolded state conformational heterogeneity and en-route intermediates, as an aid for planning and interpreting protein folding experiments. The expected kinetics were modeled for different types of energy landscapes, including multiple parallel folding routes, preferential paths dominated by one primary folding route, and distributed paths with a wide spectrum of microscopic folding rate constants. In the presence of one or more preferential routes, conformational exchange among unfolded state populations slows down the observed rates for native protein formation. We find this to be a general phenomenon, taking place even when unfolded conformations interconvert much faster than the "escape" rate constants to folding. Dramatic kinetic deceleration is expected in the presence of an increasing number of folding-incompetent unfolded conformations. This argues for the existence of parallel folding paths involving several folding-competent unfolded conformations, during the early stages of protein folding. Deviations from single-exponential behavior are observed for unfolded conformations exchanging at comparable rates or more slowly than folding events. Analysis of the effect of en-route (on-path) intermediate formation and landscape ruggedness on folding kinetics leads to the following unexpected conclusions: (1) intermediates, which often retard native state formation, may in some cases accelerate folding, and (2) rugged landscapes, usually associated with stretched exponentials, display single-exponential behavior in the presence of late high-friction paths.
Figures



Similar articles
-
Folding of horse cytochrome c in the reduced state.J Mol Biol. 2001 Oct 5;312(5):1135-60. doi: 10.1006/jmbi.2001.4993. J Mol Biol. 2001. PMID: 11580255
-
How kinetics within the unfolded state affects protein folding: an analysis based on markov state models and an ultra-long MD trajectory.J Phys Chem B. 2013 Oct 24;117(42):12787-99. doi: 10.1021/jp401962k. Epub 2013 Jun 13. J Phys Chem B. 2013. PMID: 23705683 Free PMC article.
-
Single-molecule studies of the Im7 folding landscape.J Mol Biol. 2010 Apr 23;398(1):132-45. doi: 10.1016/j.jmb.2010.02.048. Epub 2010 Mar 6. J Mol Biol. 2010. PMID: 20211187 Free PMC article.
-
Protein folding intermediates and pathways studied by hydrogen exchange.Annu Rev Biophys Biomol Struct. 2000;29:213-38. doi: 10.1146/annurev.biophys.29.1.213. Annu Rev Biophys Biomol Struct. 2000. PMID: 10940248 Review.
-
Protein folding in the landscape perspective: chevron plots and non-Arrhenius kinetics.Proteins. 1998 Jan;30(1):2-33. doi: 10.1002/(sici)1097-0134(19980101)30:1<2::aid-prot2>3.0.co;2-r. Proteins. 1998. PMID: 9443337 Review.
Cited by
-
The protein folding problem.Annu Rev Biophys. 2008;37:289-316. doi: 10.1146/annurev.biophys.37.092707.153558. Annu Rev Biophys. 2008. PMID: 18573083 Free PMC article. Review.
-
Using the unfolded state as the reference state improves the performance of statistical potentials.Biophys J. 2012 Nov 7;103(9):1950-9. doi: 10.1016/j.bpj.2012.09.023. Biophys J. 2012. PMID: 23199923 Free PMC article.
-
First Passage Times, Lifetimes, and Relaxation Times of Unfolded Proteins.Phys Rev Lett. 2015 Jul 24;115(4):048101. doi: 10.1103/PhysRevLett.115.048101. Epub 2015 Jul 21. Phys Rev Lett. 2015. PMID: 26252709 Free PMC article.
-
Site-specific collapse dynamics guide the formation of the cytochrome c' four-helix bundle.Proc Natl Acad Sci U S A. 2007 Jan 2;104(1):117-22. doi: 10.1073/pnas.0609413103. Epub 2006 Dec 19. Proc Natl Acad Sci U S A. 2007. PMID: 17179212 Free PMC article.
-
Protein folding in vitro and in the cell: From a solitary journey to a team effort.Biophys Chem. 2022 Aug;287:106821. doi: 10.1016/j.bpc.2022.106821. Epub 2022 Apr 29. Biophys Chem. 2022. PMID: 35667131 Free PMC article. Review.
References
-
- Ansari, A., Jones, C.M., Henry, E.R., Hofrichter, J., and Eaton, W.A. 1992. The role of solvent viscosity in the dynamics of protein conformational changes. Science 256: 1796–1798. - PubMed
-
- Baldwin, R.L. 1995. The nature of protein folding pathways: The classical versus the new view. J. Biomol. NMR 5: 103–109. - PubMed
-
- Brooks III, C.L. 2002. Protein and peptide folding explored with molecular simulations. Acc. Chem. Res. 35: 447–454. - PubMed
-
- Bryngelson, J.D., Onuchic, J.N., Socci, N.D., and Wolynes, P.G. 1995. Funnels, pathways, and the energy landscape of protein folding: A synthesis. Proteins 21: 167–195. - PubMed
Publication types
MeSH terms
LinkOut - more resources
Full Text Sources
Other Literature Sources
Research Materials

