

Detecting overlapping coding sequences in virus genomes
- PMID: 16483358
- PMCID: PMC1395342
- DOI: 10.1186/1471-2105-7-75
Detecting overlapping coding sequences in virus genomes
Abstract
Background: Detecting new coding sequences (CDSs) in viral genomes can be difficult for several reasons. The typically compact genomes often contain a number of overlapping coding and non-coding functional elements, which can result in unusual patterns of codon usage; conservation between related sequences can be difficult to interpret--especially within overlapping genes; and viruses often employ non-canonical translational mechanisms--e.g. frameshifting, stop codon read-through, leaky-scanning and internal ribosome entry sites--which can conceal potentially coding open reading frames (ORFs).
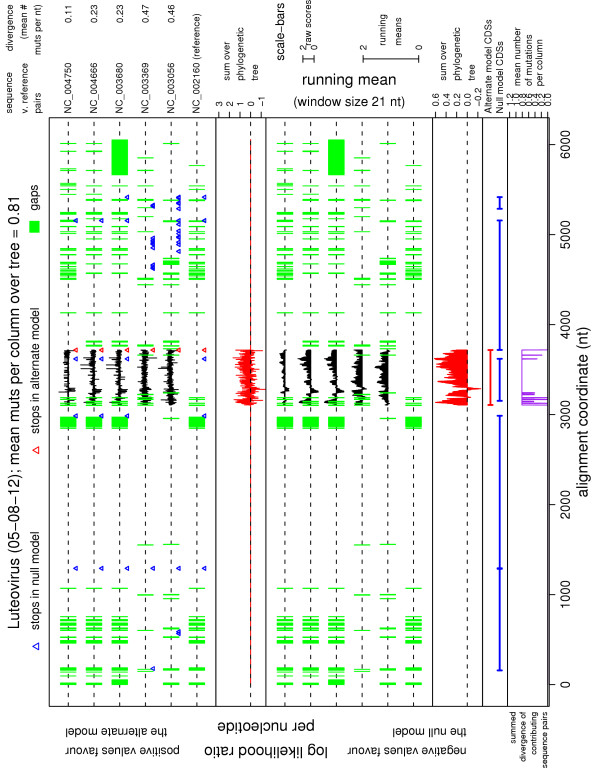
Results: In a previous paper we introduced a new statistic--MLOGD (Maximum Likelihood Overlapping Gene Detector)--for detecting and analysing overlapping CDSs. Here we present (a) an improved MLOGD statistic, (b) a greatly extended suite of software using MLOGD, (c) a database of results for 640 virus sequence alignments, and (d) a web-interface to the software and database. Tests show that, from an alignment with just 20 mutations, MLOGD can discriminate non-overlapping CDSs from non-coding ORFs with a typical accuracy of up to 98%, and can detect CDSs overlapping known CDSs with a typical accuracy of 90%. In addition, the software produces a variety of statistics and graphics, useful for analysing an input multiple sequence alignment.
Conclusion: MLOGD is an easy-to-use tool for virus genome annotation, detecting new CDSs--in particular overlapping or short CDSs--and for analysing overlapping CDSs following frameshift sites. The software, web-server, database and supplementary material are available at http://guinevere.otago.ac.nz/mlogd.html.
Figures

Similar articles
-
Detecting overlapping coding sequences with pairwise alignments.Bioinformatics. 2005 Feb 1;21(3):282-92. doi: 10.1093/bioinformatics/bti007. Epub 2004 Sep 3. Bioinformatics. 2005. PMID: 15347574
-
Bioinformatic analysis suggests that the Orbivirus VP6 cistron encodes an overlapping gene.Virol J. 2008 Apr 14;5:48. doi: 10.1186/1743-422X-5-48. Virol J. 2008. PMID: 18489030 Free PMC article.
-
Bioinformatic analysis suggests that the Cypovirus 1 major core protein cistron harbours an overlapping gene.Virol J. 2008 May 20;5:62. doi: 10.1186/1743-422X-5-62. Virol J. 2008. PMID: 18492230 Free PMC article.
-
Computational methods for inferring location and genealogy of overlapping genes in virus genomes: approaches and applications.Curr Opin Virol. 2022 Feb;52:1-8. doi: 10.1016/j.coviro.2021.10.009. Epub 2021 Nov 16. Curr Opin Virol. 2022. PMID: 34798370 Free PMC article. Review.
-
tRNA-mimicry in IRES-mediated translation and recoding.RNA Biol. 2016 Nov;13(11):1068-1074. doi: 10.1080/15476286.2016.1219833. Epub 2016 Aug 11. RNA Biol. 2016. PMID: 27654067 Free PMC article. Review.
Cited by
-
Evolution of viral proteins originated de novo by overprinting.Mol Biol Evol. 2012 Dec;29(12):3767-80. doi: 10.1093/molbev/mss179. Epub 2012 Jul 19. Mol Biol Evol. 2012. PMID: 22821011 Free PMC article.
-
Mapping overlapping functional elements embedded within the protein-coding regions of RNA viruses.Nucleic Acids Res. 2014 Nov 10;42(20):12425-39. doi: 10.1093/nar/gku981. Epub 2014 Oct 17. Nucleic Acids Res. 2014. PMID: 25326325 Free PMC article.
-
On programmed ribosomal frameshifting: the alternative proteomes.Front Genet. 2012 Nov 19;3:242. doi: 10.3389/fgene.2012.00242. eCollection 2012. Front Genet. 2012. PMID: 23181069 Free PMC article.
-
Orientation-dependent toxic effect of human papillomavirus type 33 long control region DNA in Escherichia coli cells.Virus Genes. 2020 Jun;56(3):298-305. doi: 10.1007/s11262-020-01754-4. Epub 2020 Apr 3. Virus Genes. 2020. PMID: 32246353 Free PMC article.
-
Stimulation of stop codon readthrough: frequent presence of an extended 3' RNA structural element.Nucleic Acids Res. 2011 Aug;39(15):6679-91. doi: 10.1093/nar/gkr224. Epub 2011 Apr 27. Nucleic Acids Res. 2011. PMID: 21525127 Free PMC article.
References
-
- Badger JH, Olsen GJ. CRITICA: Coding Region Identification Tool Invoking Comparative Analysis. Mol Biol Evol. 1999;16:512–524. - PubMed
-
- Felsenstein J. PHYLIP (Phylogeny Inference Package) version 3.6. 2004. http://evolution.genetics.washington.edu/phylip.html
Publication types
MeSH terms
Substances
LinkOut - more resources
Full Text Sources
