The HIV lipidome: a raft with an unusual composition
- PMID: 16481622
- PMCID: PMC1413831
- DOI: 10.1073/pnas.0511136103
The HIV lipidome: a raft with an unusual composition
Abstract
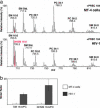
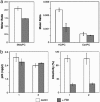
The lipids of enveloped viruses play critical roles in viral morphogenesis and infectivity. They are derived from the host membranes from which virus budding occurs, but the precise lipid composition has not been determined for any virus. Employing mass spectrometry, this study provides a quantitative analysis of the lipid constituents of HIV and a comprehensive comparison with its host membranes. Both a substantial enrichment of the unusual sphingolipid dihydrosphingomyelin and a loss of viral infectivity upon inhibition of sphingolipid biosynthesis in host cells are reported, establishing a critical role for this lipid class in the HIV replication cycle. Intriguingly, the overall lipid composition of native HIV membranes resembles detergent-resistant membrane microdomains and is strikingly different from that of host cell membranes. With this composition, the HIV lipidome provides strong evidence for the existence of lipid rafts in living cells.
Conflict of interest statement
Conflict of interest statement: The communicating member K.S. is a founder in a small start-up company called Jado Technologies that has raft technology as its specialty.
Figures


Similar articles
-
Lipid composition of membrane rafts, isolated with and without detergent, from the spleen of a mouse model of Gaucher disease.Biochem Biophys Res Commun. 2013 Dec 6;442(1-2):62-7. doi: 10.1016/j.bbrc.2013.11.009. Epub 2013 Nov 9. Biochem Biophys Res Commun. 2013. PMID: 24220330
-
Modulation of entry of enveloped viruses by cholesterol and sphingolipids (Review).Mol Membr Biol. 2003 Jul-Sep;20(3):243-54. doi: 10.1080/0968768031000104944. Mol Membr Biol. 2003. PMID: 12893532 Review.
-
Comparative lipidomics analysis of HIV-1 particles and their producer cell membrane in different cell lines.Cell Microbiol. 2013 Feb;15(2):292-304. doi: 10.1111/cmi.12101. Epub 2013 Jan 10. Cell Microbiol. 2013. PMID: 23279151
-
Human immunodeficiency virus type 1 Nef protein modulates the lipid composition of virions and host cell membrane microdomains.Retrovirology. 2007 Oct 1;4:70. doi: 10.1186/1742-4690-4-70. Retrovirology. 2007. PMID: 17908312 Free PMC article.
-
HIV-1, lipid rafts, and antibodies to liposomes: implications for anti-viral-neutralizing antibodies.Mol Membr Biol. 2006 Nov-Dec;23(6):453-65. doi: 10.1080/09687860600935348. Mol Membr Biol. 2006. PMID: 17127618 Review.
Cited by
-
Protocells by spontaneous reaction of cysteine with short-chain thioesters.Nat Chem. 2024 Oct 30. doi: 10.1038/s41557-024-01666-y. Online ahead of print. Nat Chem. 2024. PMID: 39478161
-
HIV-1 Gag Polyprotein Affinity to the Lipid Membrane Is Independent of Its Surface Charge.Biomolecules. 2024 Aug 29;14(9):1086. doi: 10.3390/biom14091086. Biomolecules. 2024. PMID: 39334852 Free PMC article.
-
Probing Gag-Env dynamics at HIV-1 assembly sites using live-cell microscopy.J Virol. 2024 Sep 17;98(9):e0064924. doi: 10.1128/jvi.00649-24. Epub 2024 Aug 13. J Virol. 2024. PMID: 39136462 Free PMC article.
-
Insertion and Anchoring of HIV-1 Fusion Peptide into Complex Membrane Mimicking Human T-cell.bioRxiv [Preprint]. 2024 Aug 4:2024.08.02.606381. doi: 10.1101/2024.08.02.606381. bioRxiv. 2024. PMID: 39131401 Free PMC article. Preprint.
-
Antiviral activity of the host defense peptide piscidin 1: investigating a membrane-mediated mode of action.Front Chem. 2024 Jun 26;12:1379192. doi: 10.3389/fchem.2024.1379192. eCollection 2024. Front Chem. 2024. PMID: 38988727 Free PMC article.
References
-
- Simons K., Vaz W. L. Annu. Rev. Biophys. Biomol. Struct. 2004;33:269–295. - PubMed
-
- Ono A., Freed E. O. Adv. Virus Res. 2005;64:311–358. - PubMed
-
- Kusumi A., Koyama-Honda I., Suzuki K. Traffic. 2004;5:213–230. - PubMed
-
- Simons K., Toomre D. Nat. Rev. Mol. Cell Biol. 2000;1:31–39. - PubMed
-
- Munro S. Cell. 2003;115:377–388. - PubMed
Publication types
MeSH terms
Substances
LinkOut - more resources
Full Text Sources
Other Literature Sources

